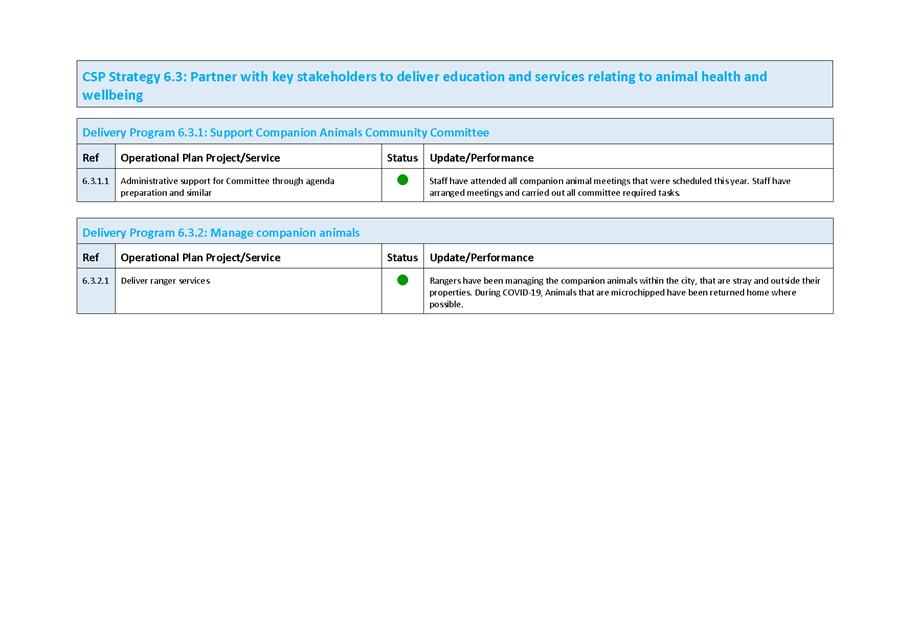
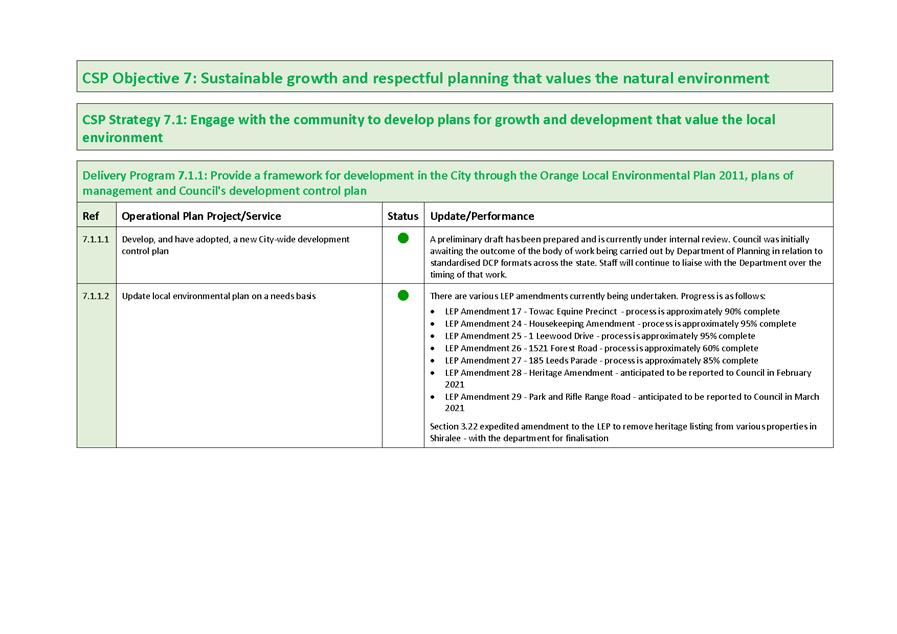
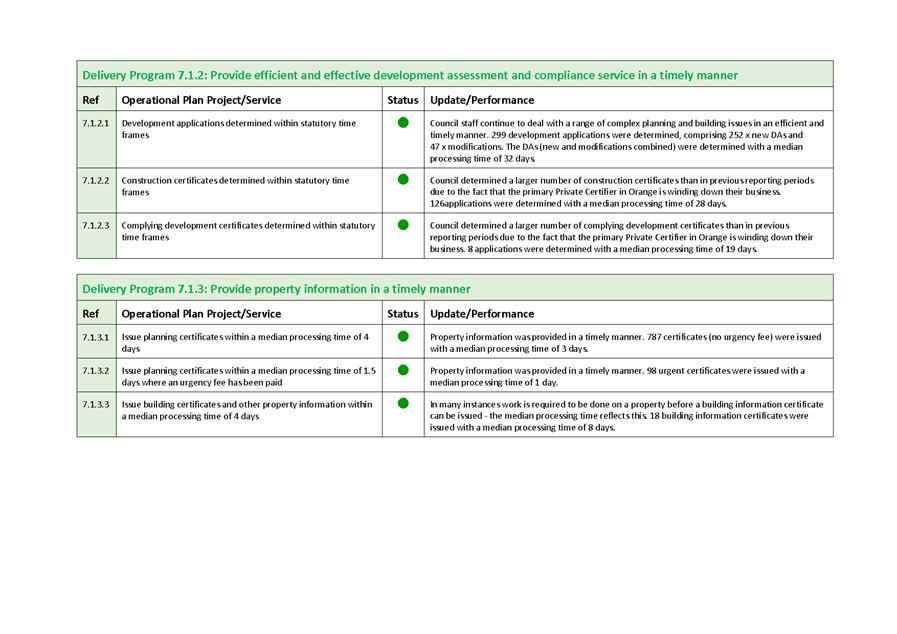
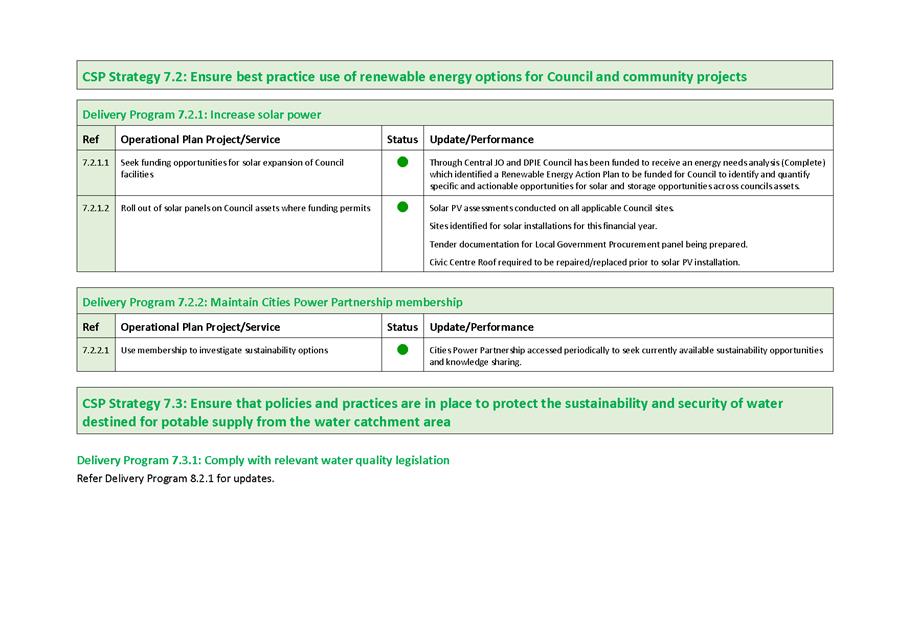
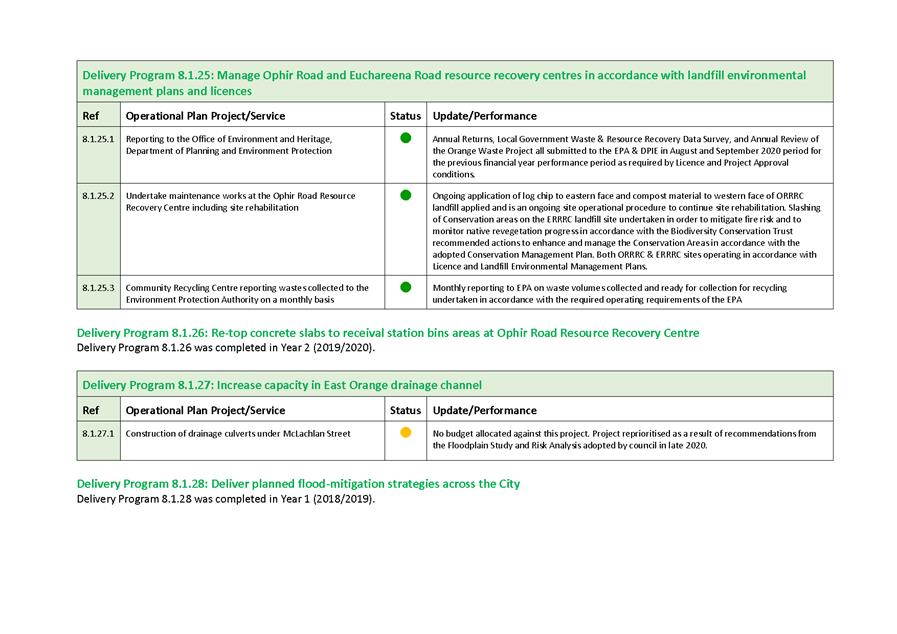
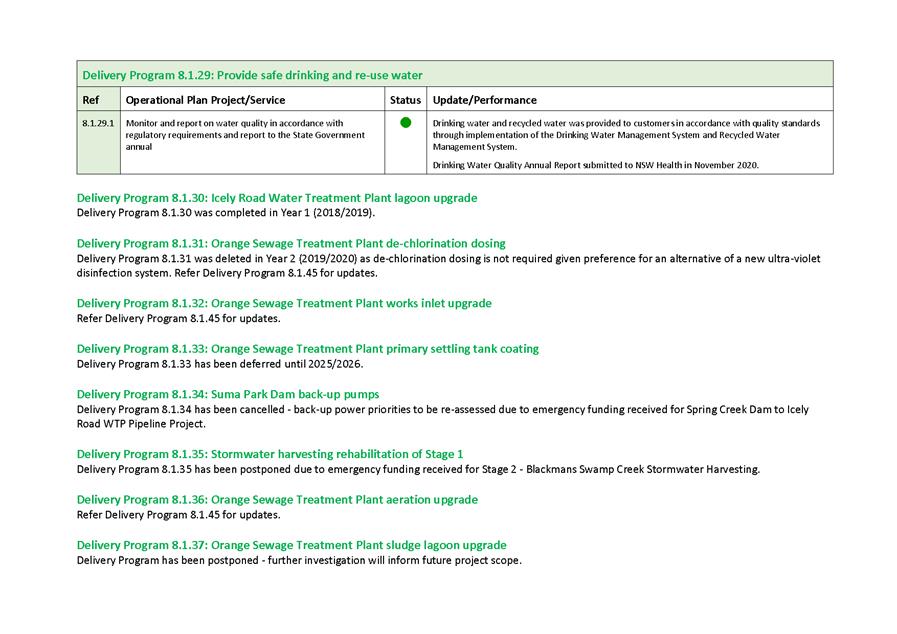
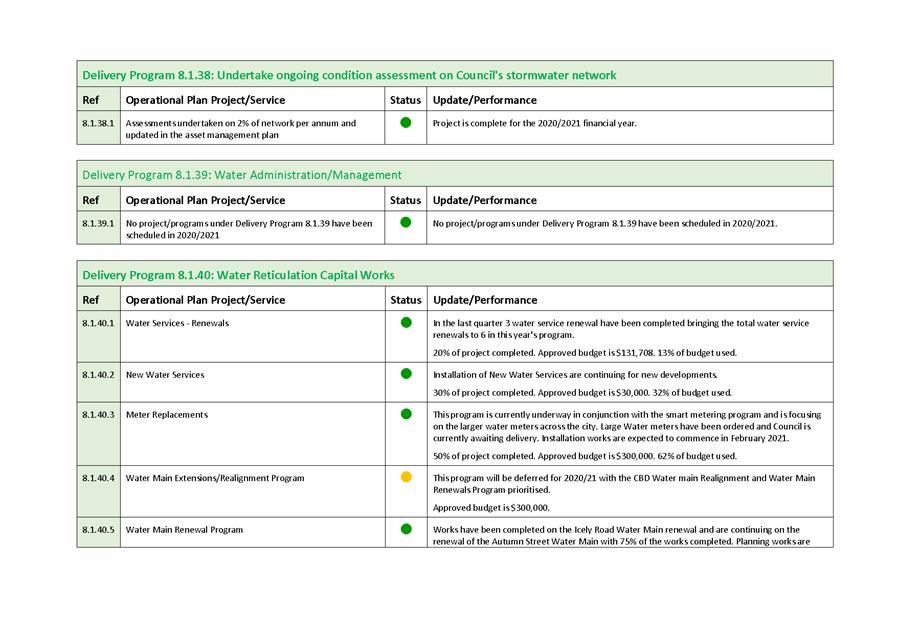
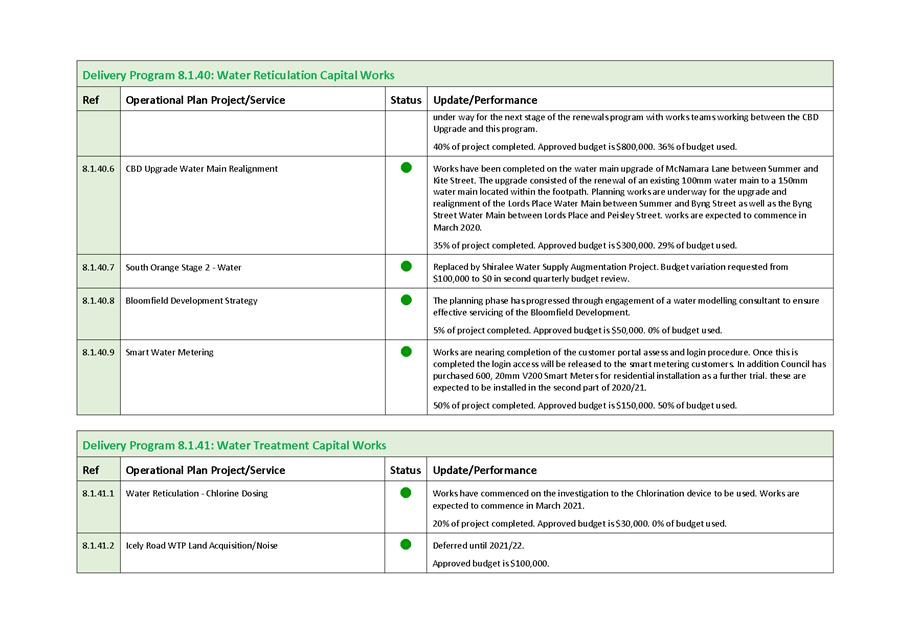
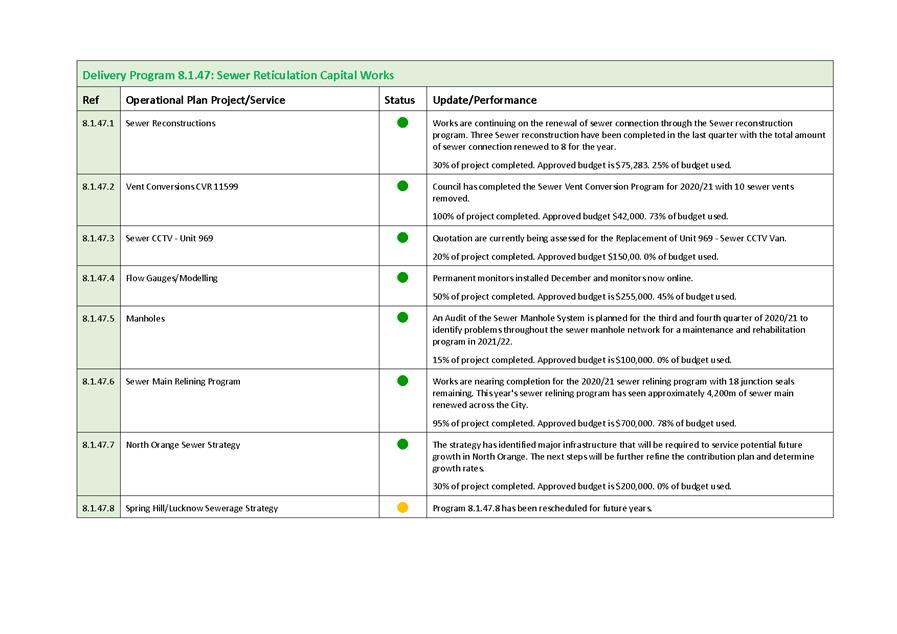
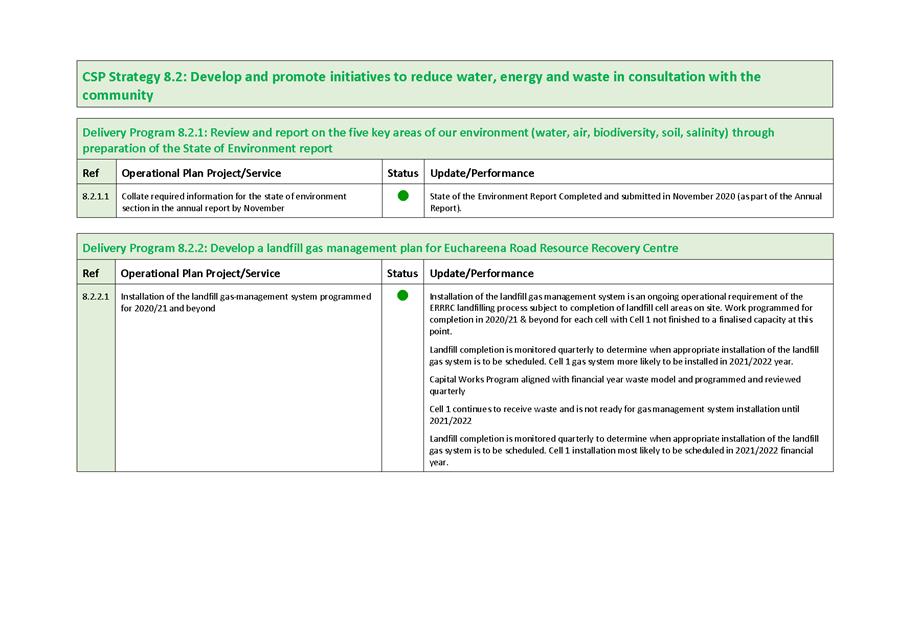
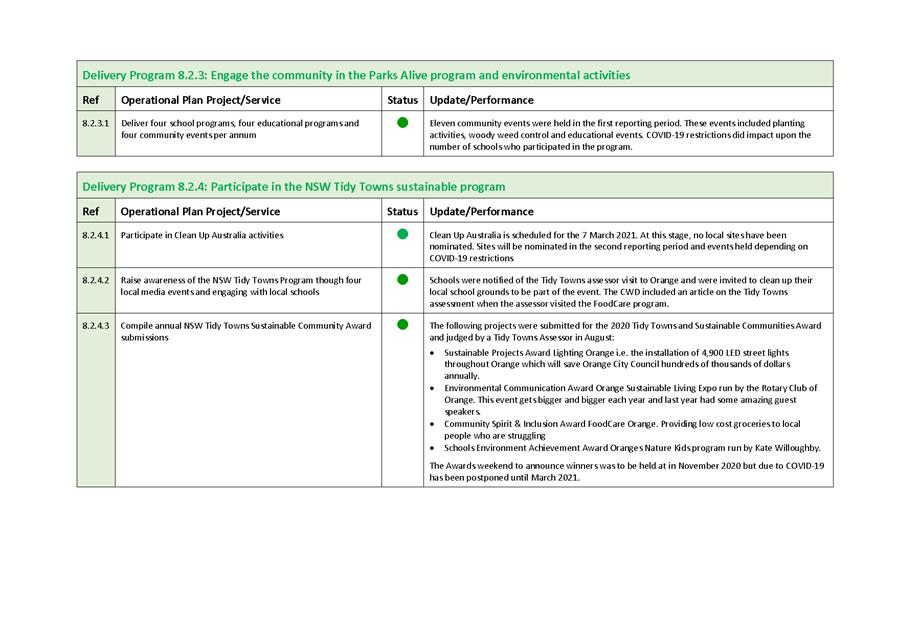
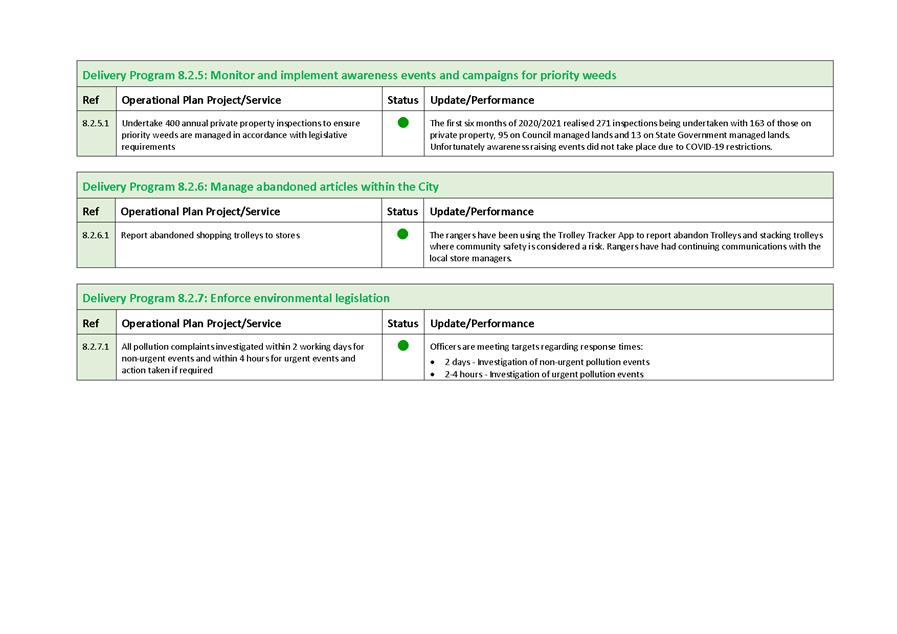
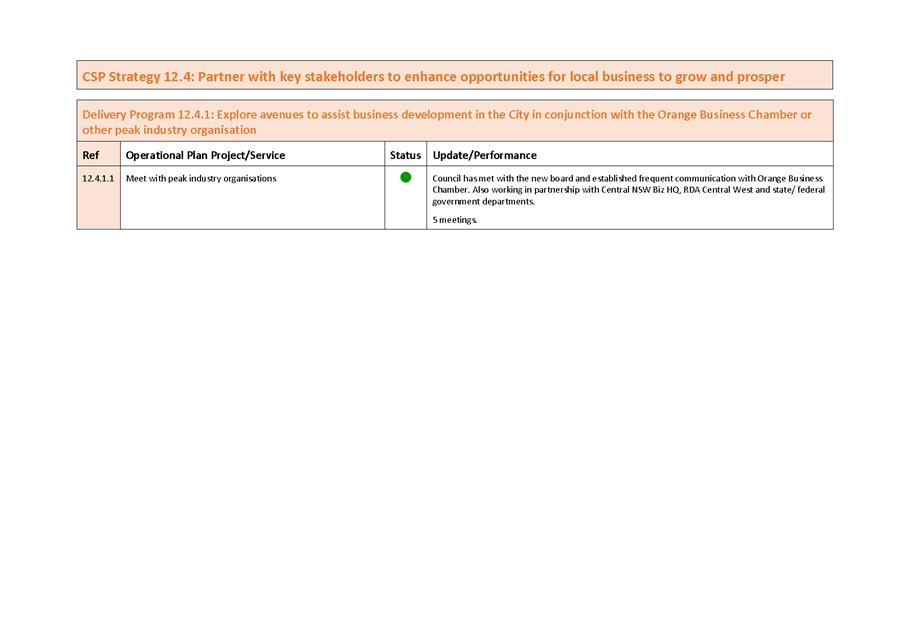
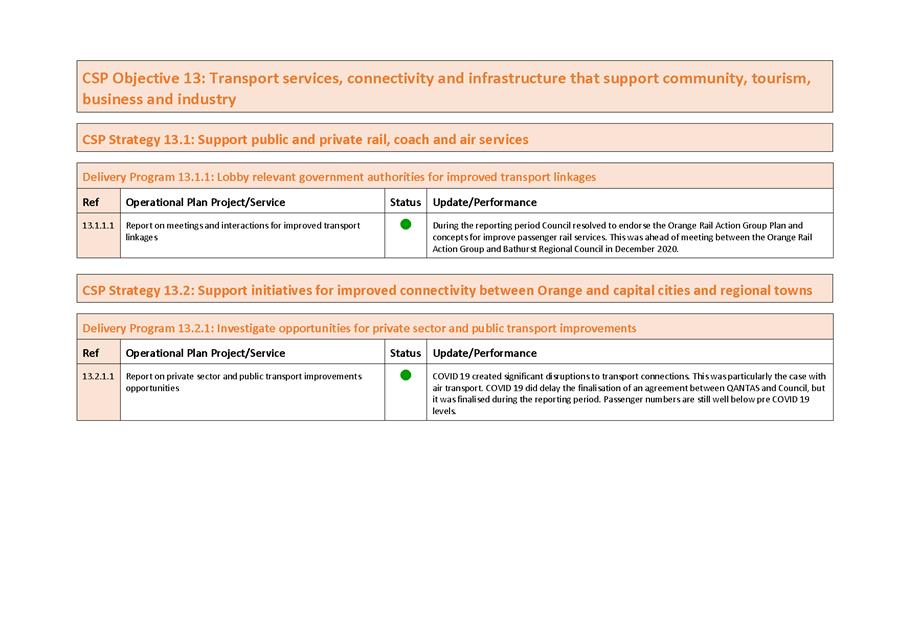
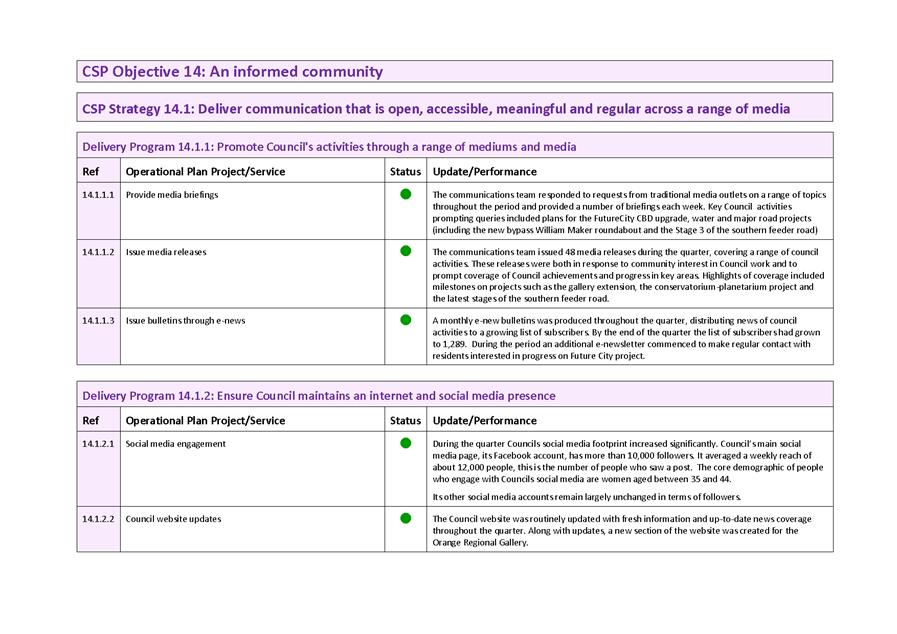
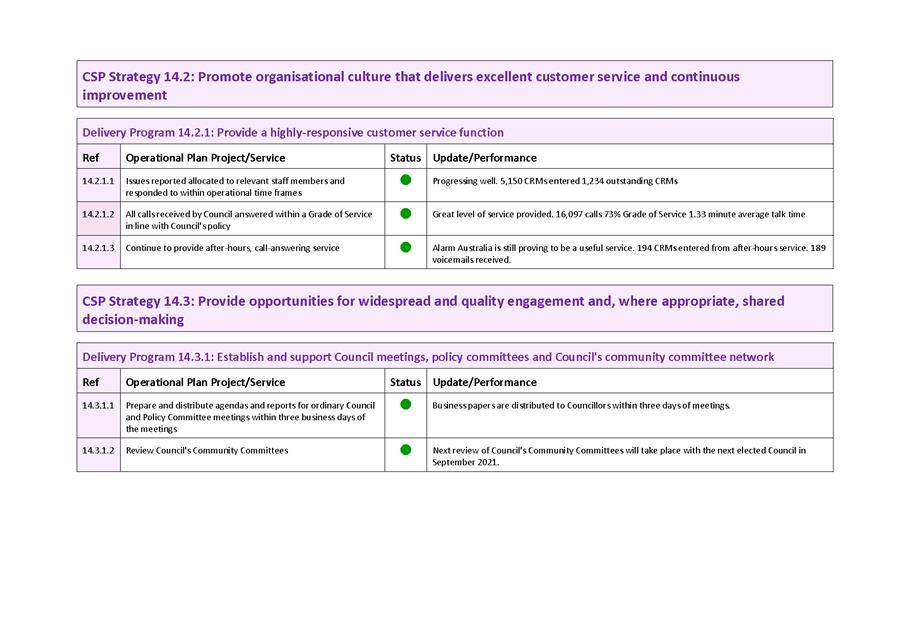
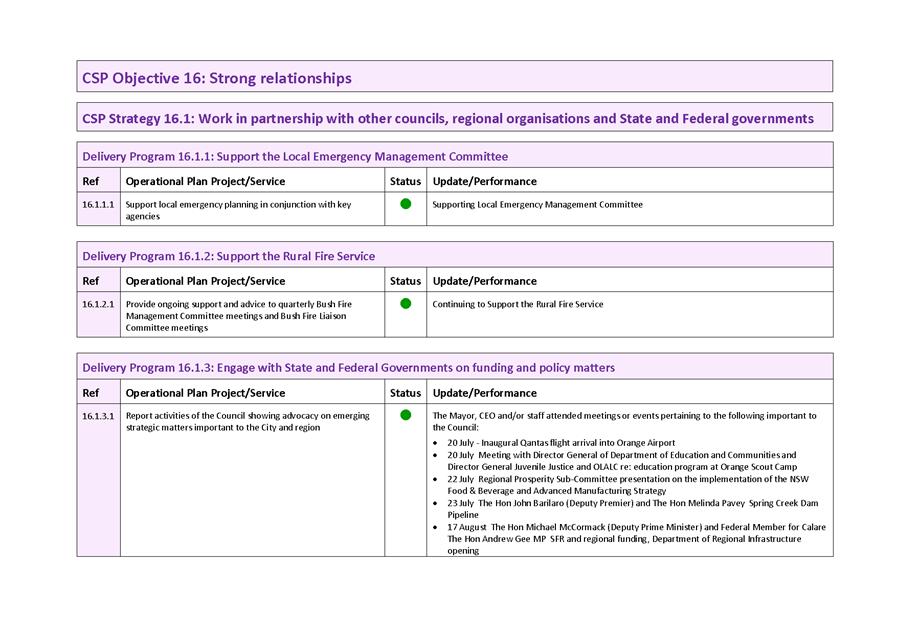
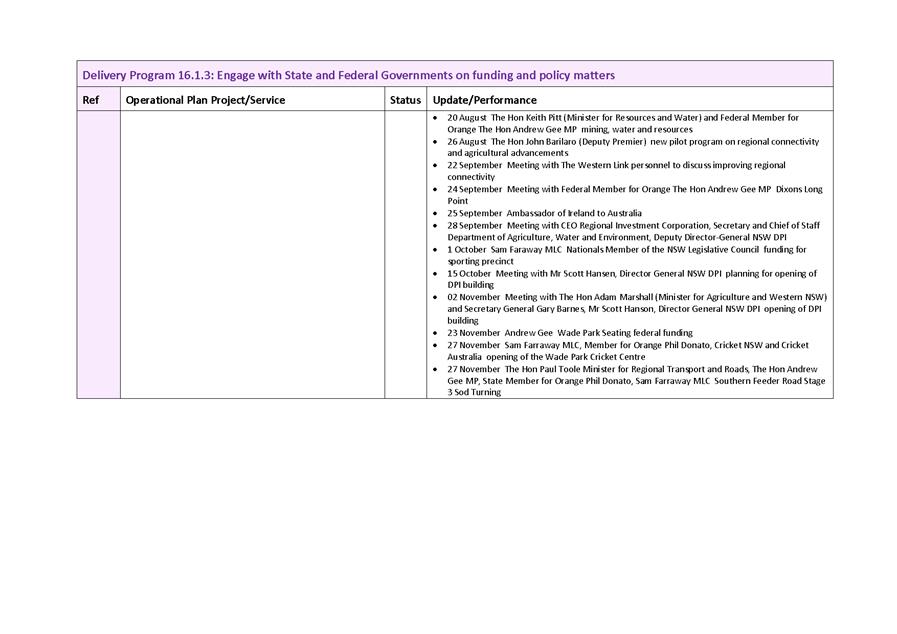
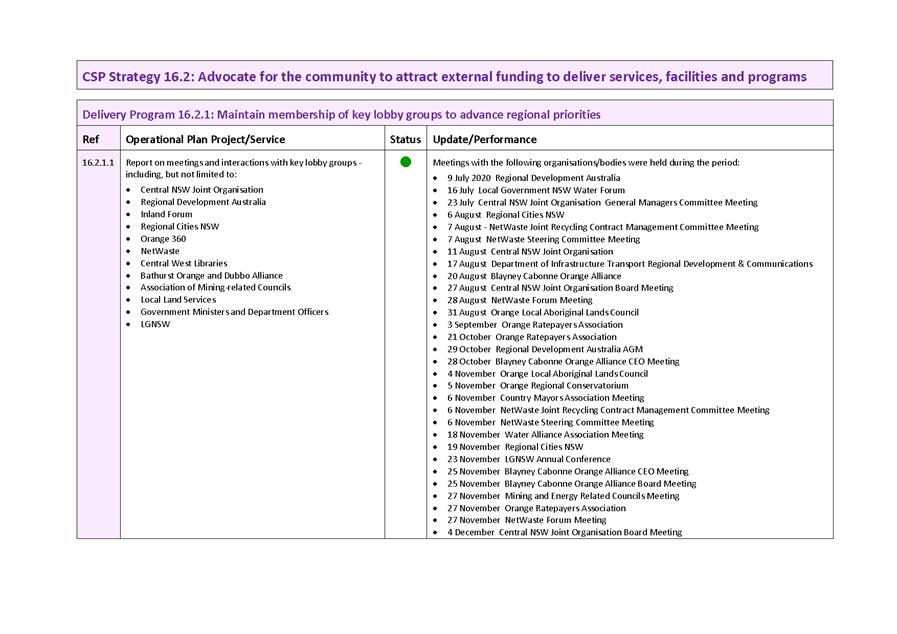
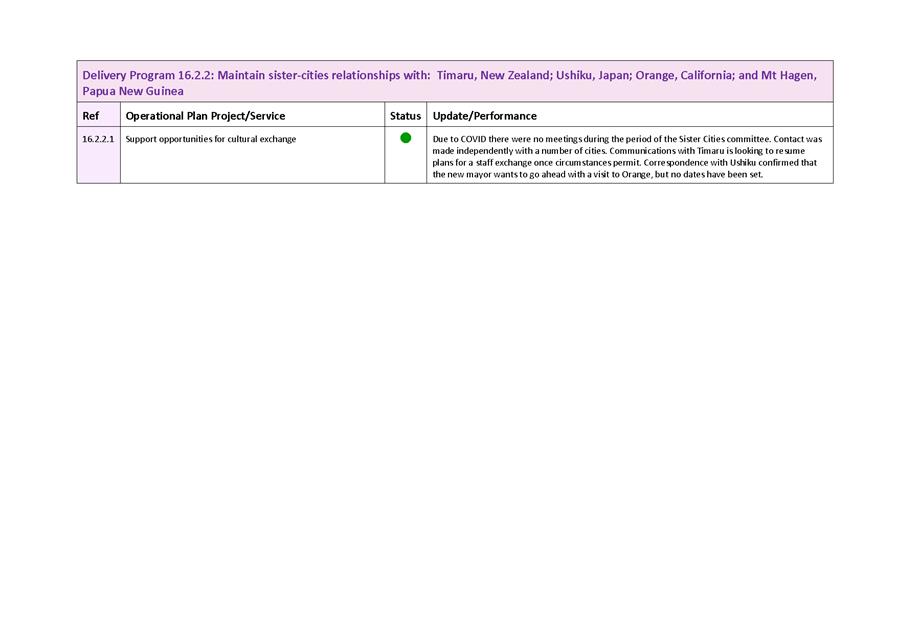
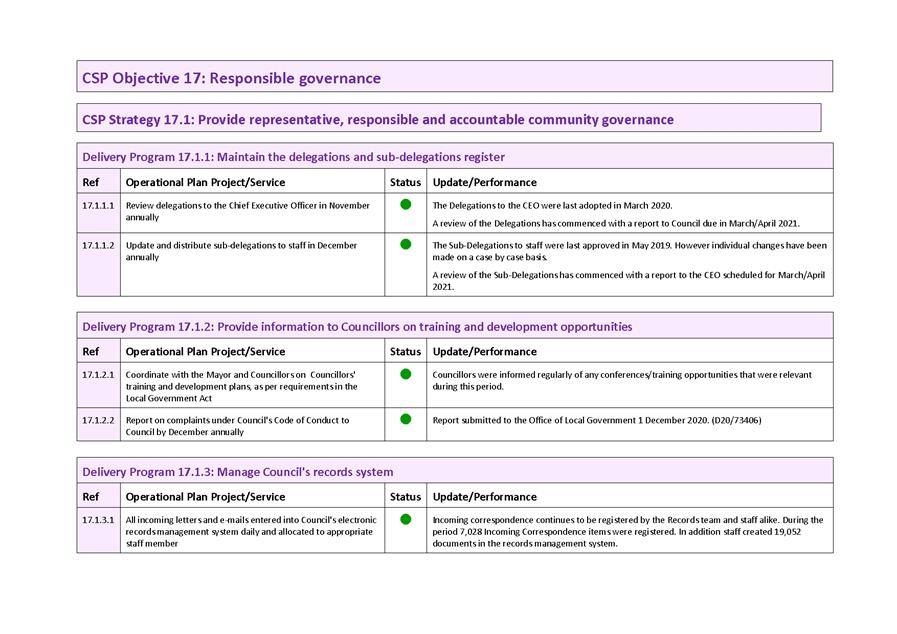
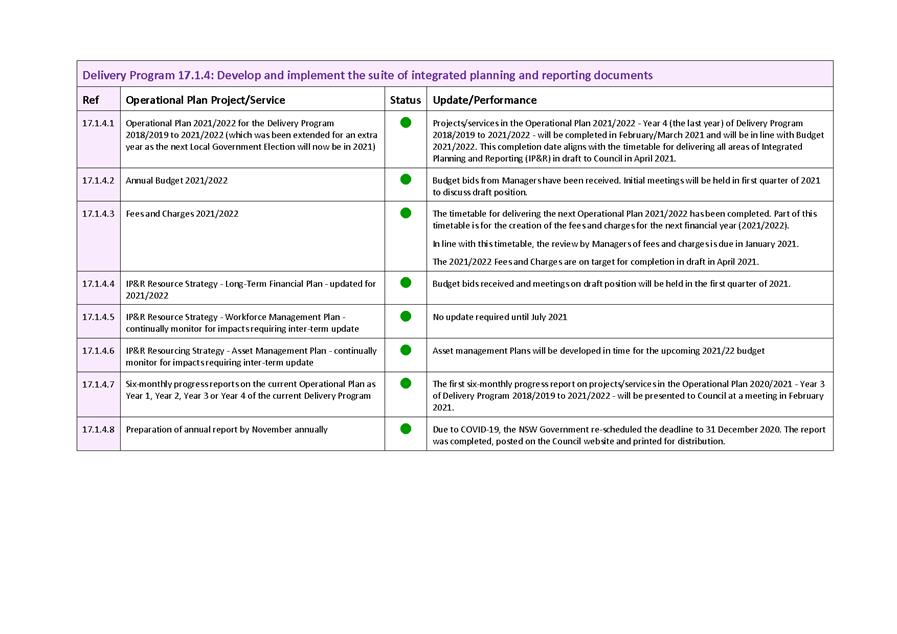
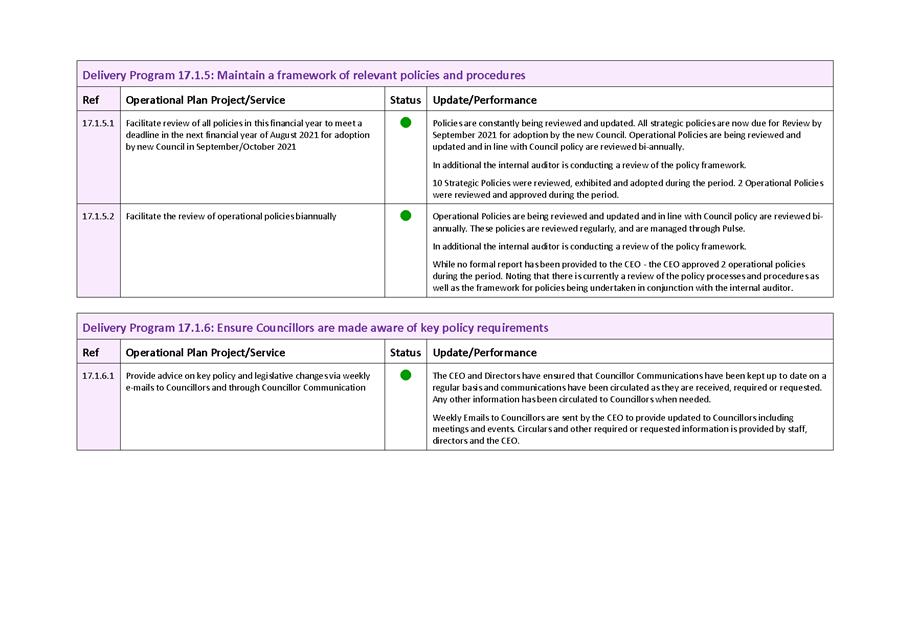
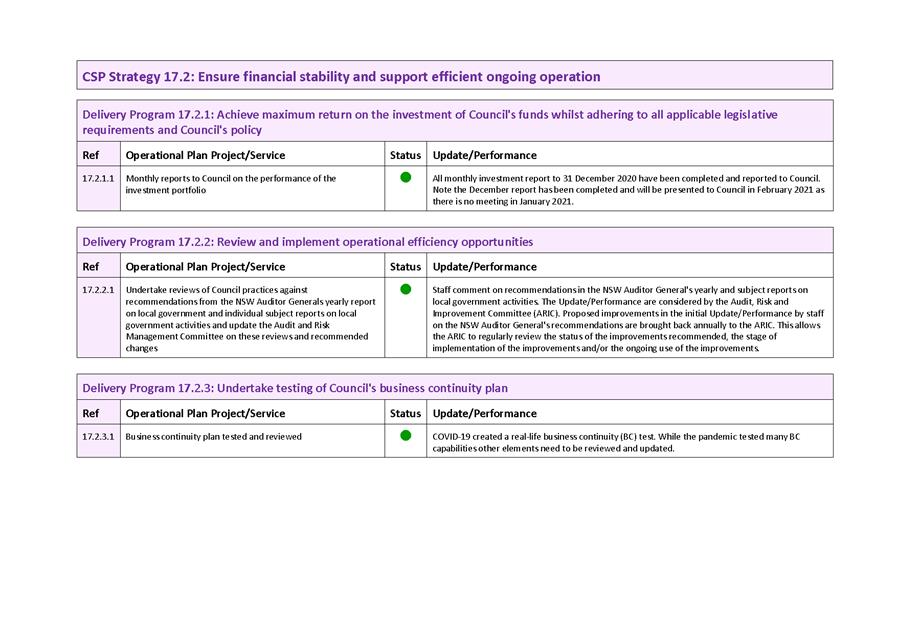
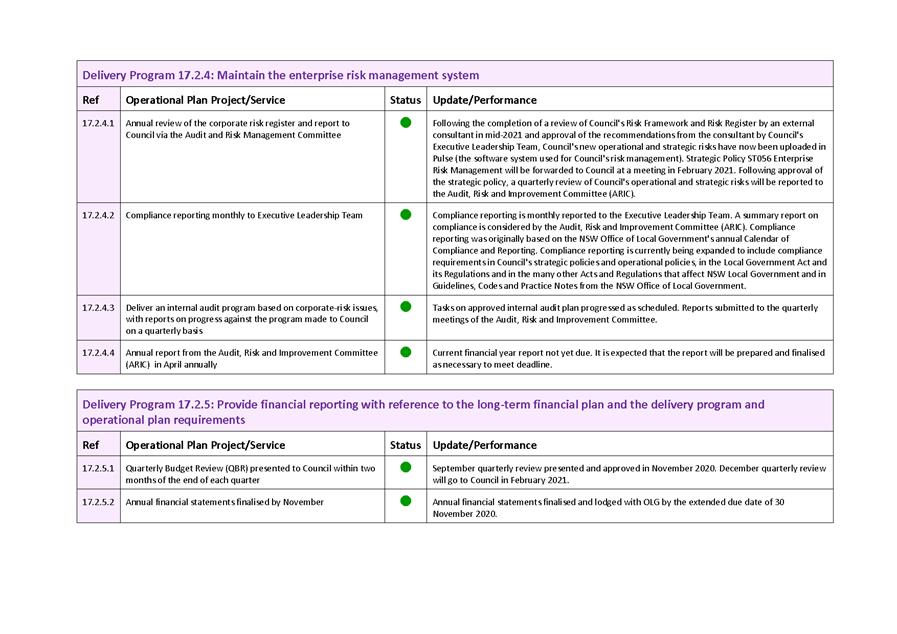
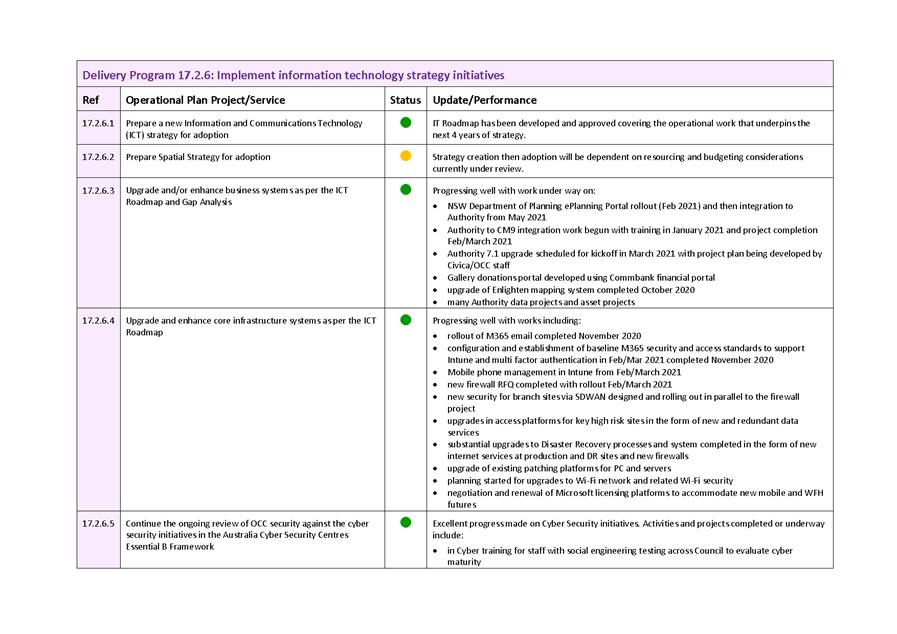
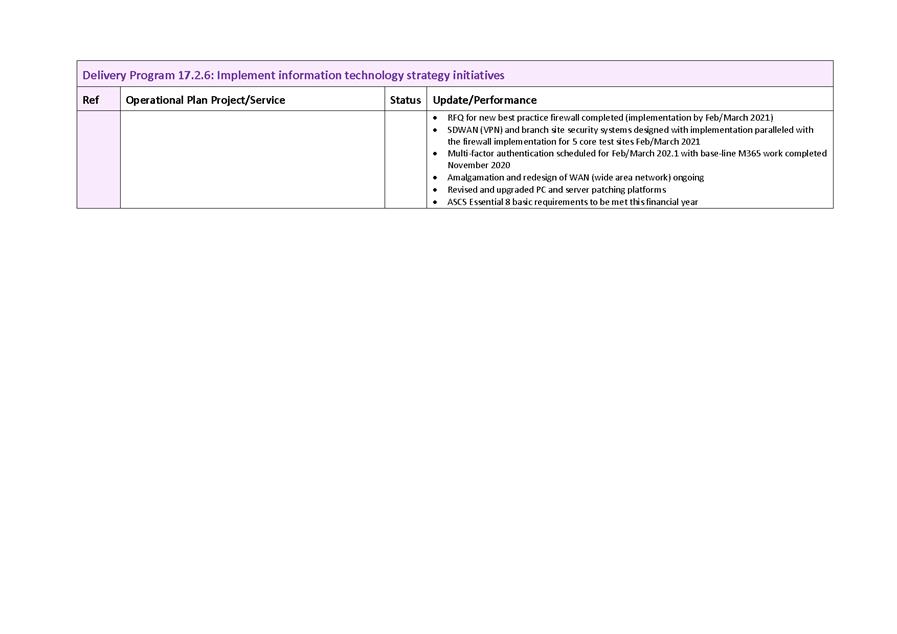
2 General
Reports
2.1 Statement
of Investments - December 2020
TRIM
REFERENCE: 2021/4
AUTHOR: Julie
Murray, Financial Accountant
EXECUTIVE SUMMARY
The purpose of this report is to provide a statement of
Council’s investments held as at 31 December 2020.
Link To Delivery/OPerational Plan
The recommendation in this report relates to the
Delivery/Operational Plan strategy “17.2 Collaborate - Ensure financial
stability and support efficient ongoing operation”.
Financial Implications
Nil
Policy and Governance Implications
Nil
|
Recommendation
That Council resolves:
1 To note the Statement
of Investments as at 31 December 2020.
2 To
adopt the certification of the Responsible Accounting Officer.
|
further considerations
Consideration has been given to the recommendation’s
impact on Council’s service delivery; image and reputation; political;
environmental; health and safety; employees; stakeholders and project
management; and no further implications or risks have been identified.
SUPPORTING INFORMATION
Section 212(1) of the Local Government (General) Regulation
2005 requires that a written report be presented each month at an Ordinary
Meeting of the Council detailing all money that Council has invested under
Section 625 of the Local Government Act 1993.
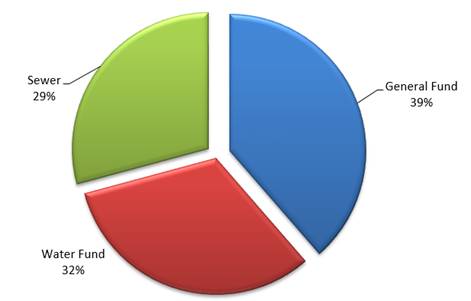
As at 31 December 2020, the investments held by Council in
each fund is shown below:
|
|
31/12/2020
|
30/11/2020
|
|
General
Fund
|
72,090,110.55
|
74,191,923.58
|
|
Water Fund
|
60,204,933.64
|
59,706,595.16
|
|
Sewer
Fund
|
54,510,635.20
|
53,144,050.39
|
|
|
|
|
|
Total
Funds
|
186,805,679.39
|
187,042,569.13
|
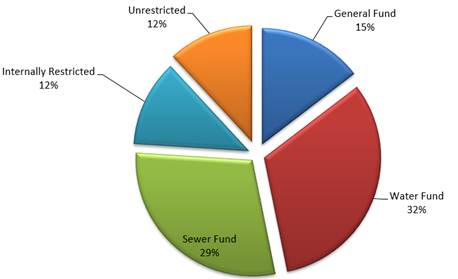
A reconciliation of Council’s investment portfolio
provides a summary of the purposes for which Council’s investments are
being held. The summary is as follows:
|
31/12/2020
|
30/11/2020
|
|
Externally
Restricted
|
|
|
|
- General Fund
|
27,248,222.24
|
28,633,855.13
|
|
- Water Fund
|
60,204,933.64
|
59,706,595.16
|
|
- Sewer Fund
|
54,510,635.20
|
53,144,050.39
|
|
Internally
Restricted
|
22,639,658.08
|
21,557,442.57
|
|
Unrestricted
|
22,202,230.23
|
24,000,625.88
|
|
Total
Funds
|
186,805,679.39
|
$187,042,569.13
|
The unrestricted cash position movements during the month
are normal as projects commence and income is received. Movements may also
arise following processing of income received between funds or into restricted
assets to appropriately allocate for the purposes Council has determined. Council’s
cash flow is monitored on a daily basis and some investments may be redeemed
rather than rolled over to support operational requirements.
Portfolio Advice
Council utilises the services of an
independent investment advisor in maintaining its portfolio of investments.
Council’s current investment advisor is Imperium Markets, an independent
asset consultant that works with wholesale investors to develop, implement and
manage their investment portfolio. Imperium Markets is a leading provider of
independent investment consulting services to a broad range of institutional
investors including government agencies, superannuation funds and
not-for-profit organisations.
Imperium Markets major services
provided to Council include:
· Quarterly
portfolio summary reports
· Advice
on investment opportunities, in particular Floating Rate Note products
· Advice
on policy construction
· Year-end
market values for Floating Note Rate products held by Council.
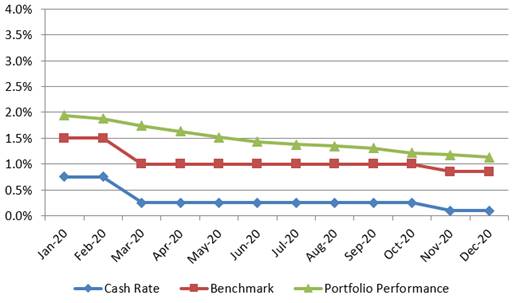
Portfolio Performance
Council’s current Long Term Financial Plan establishes
the benchmark for Council’s interest on investments at “75 basis
points above the current cash rate”. The cash rate as at 31 December 2021
remained at 0.10 per cent. The weighted average interest rate of
Council’s investment portfolio at the same reporting date was 1.13 per
cent which continues to exceed Council’s benchmark i.e. the cash rate of
0.10 per cent plus 0.75 per cent (or 85 basis points).
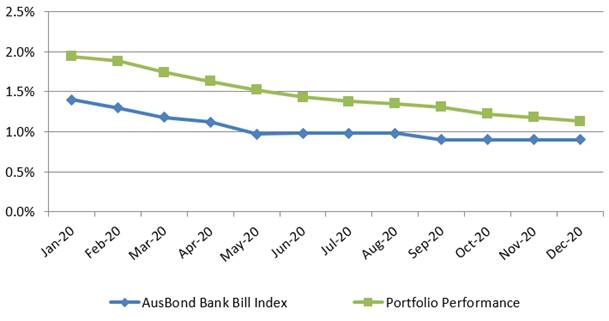
Council has also utilised the AusBond Bank Bill Index to
provide a further benchmark focused towards long term investments. As at 31
December 2021, the AusBond rate was 0.90 per cent. The weighted average
interest rate of Council’s investment portfolio at the same reporting
date was 1.13 per cent.
Council’s Investment Policy establishes limits in
relation to the maturity terms of Council’s investments as well as the
credit ratings of the institutions with whom Council can invest.
The following tables provide a dissection of Council’s
investment portfolio as required by the Policy. The Policy identifies the
maximum amount that can be held in a variety of investment products or with
institutions based on their respective credit ratings.
Table 1 shows the percentage held by Council (holdings) and
the additional amount that Council could hold (capacity) for each term to
maturity allocation in accordance with limits established by Council’s
Policy.
Table
1: Maturity – Term Limits
|
Term to Maturity Allocation
|
Maximum
|
Holding
|
Remaining Capacity
|
|
0 - 3 Months
|
100.00%
|
26.46%
|
73.54%
|
|
3 - 12 Months
|
100.00%
|
44.33%
|
55.67%
|
|
1 - 2 Years
|
70.00%
|
15.99%
|
54.01%
|
|
2 - 5 Years
|
50.00%
|
13.22%
|
36.78%
|
|
5+ Years
|
25.00%
|
0.00%
|
25.00%
|
Table 2 shows the total amount held, and the weighted
average interest rate (or return on investment), by credit rating. The credit
rating is an independent opinion of the capability and willingness of a
financial institution to repay its debts, or in other words, the
providers’ financial strength or creditworthiness. The rating is
typically calculated as the likelihood of a failure occurring over a given
period, with the higher rating (AAA) being superior due to having a lower
chance of default. However, it is generally accepted that this lower risk will
be accompanied by a lower return on investment.
The level of money held in the bank accounts has been added
to the table to illustrate the ability of Council to cover the operational
liabilities that typically occur (for example payroll, materials and contracts,
utilities).
Table 2: Credit Rating Limits
|
Credit
Rating
|
Maximum
|
Holding
|
Remaining
Capacity
|
Value
|
Return
on Investment
|
|
Bank
Accounts
|
100.00%
|
5.25%
|
94.75%
|
$9,812,646.60
|
0.10%
|
|
AAA
|
100.00%
|
0.00%
|
100.00%
|
N/A
|
N/A
|
|
AA
|
100.00%
|
42.16%
|
57.84%
|
$78,756,160.00
|
1.27%
|
|
A
|
60.00%
|
24.57%
|
35.43%
|
$45,900,000.00
|
1.04%
|
|
BBB
& NR
|
40.00%
|
28.02%
|
11.98%
|
$52,336,872.79
|
1.00%
|
|
Below
BBB
|
0.00%
|
0.00%
|
0.00%
|
N/A
|
N/A
|
Certification by Responsible
Accounting Officer
I, Jason Cooke, hereby certify that all investments have
been made in accordance with Section 625 of the Local Government Act 1993,
Clause 212 of the Local Government (General) Regulation 2005 and
Council’s Investment Policy.
2.2 Quarterly
Budget Review and Progress Report - Quarter 2 of 2020/2021
RECORD
NUMBER: 2021/22
AUTHOR: Jason
Cooke, Chief Financial Officer
EXECUTIVE Summary
This report provides the first quarter review of the
2019-2022 Delivery/Operational Plan, as required under section 403 of the Local
Government Act 1993. This report illustrates the progress Council is making
on the strategies and tasks identified in its strategic planning documents.
This report also provides a summary of Council’s
financial position over the quarter. The Directions (Collaborate, Live,
Prosper, Preserve) financial summary tables with the attached Performance
Indicators and quarterly review documents have been reviewed and updated and
include projects across all three funds (General, Water and Sewer).
Link To Delivery/OPerational Plan
The recommendation in this report relates to the
Delivery/Operational Plan strategy “17.2 Collaborate - Ensure financial
stability and support efficient ongoing operation”.
Financial Implications
The Quarterly Review has identified favourable variations
totalling $1,816,670 to Council’s adopted September 2020 quarterly
budget. The effect of these variations results in Council’s projected
overall year-end consolidated position becoming a much smaller deficit of
$1,550,465 including capital.
Table 1 below presents Council’s projected year-end
result by Direction as identified in the Community Strategic Plan and the
Delivery/Operational Plan. It is important to note that all red bracketed
numbers in Tables 1-3 below indicate a surplus result for Council.
|
Direction
|
Adopted Budget
|
Proposed Variations
|
Proposed Budget
|
|
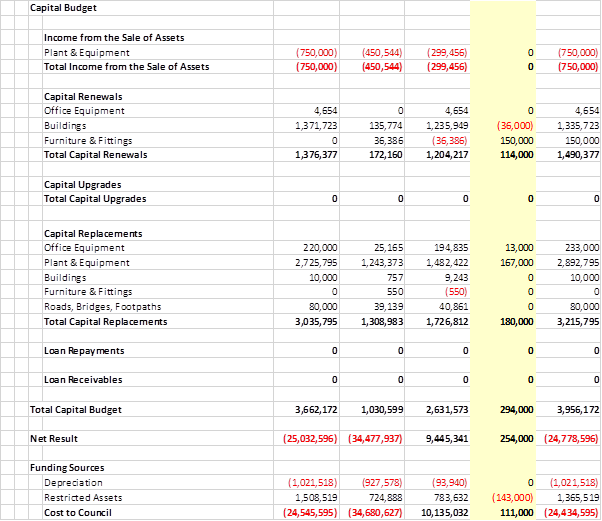
Collaborate
|
(24,545,595)
|
111,000
|
(24,434,595)
|
|
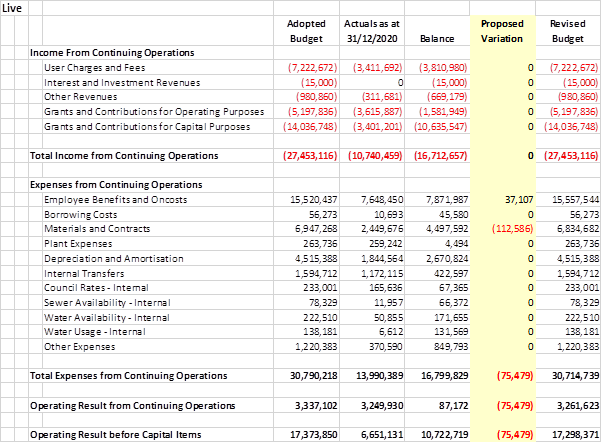
Live
|
15,583,654
|
(33,679)
|
15,549,975
|
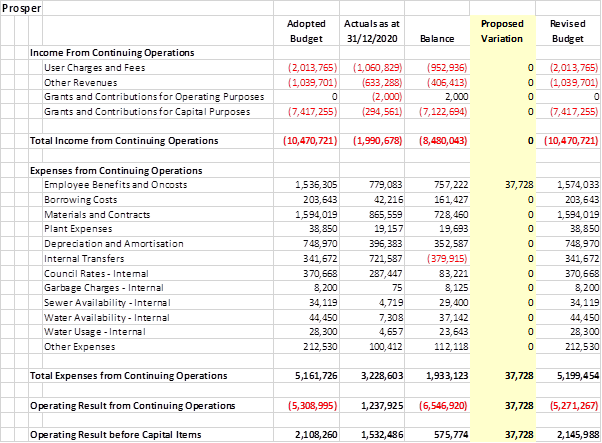
|
Prosper
|
1,083,255
|
72,728
|
1,155,983
|
|
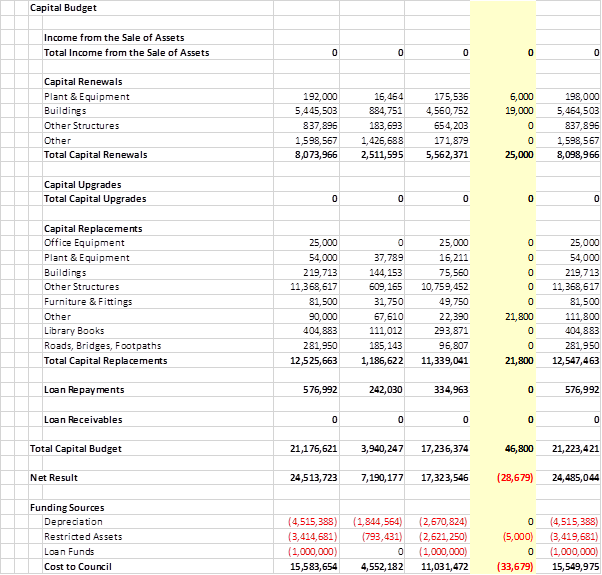
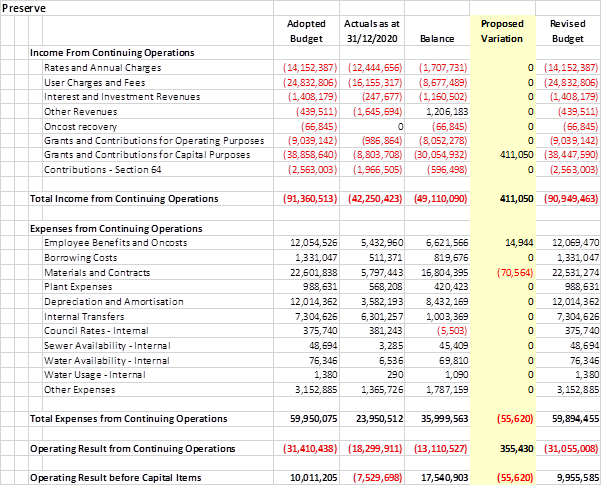
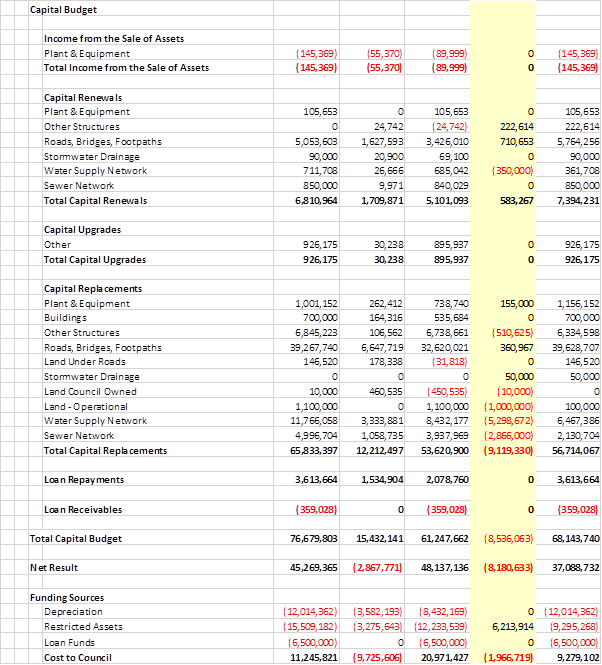
Preserve
|
11,245,821
|
(1,966,719)
|
9,279,102
|
|
Total
|
3,367,135
|
(1,816,670)
|
1,550,465
|
Table 1: Projected year-end
position by Direction
Table 2 presents Council’s projected year-end result
by Fund, showing Cost to Council (which includes capital expenditure, capital
income and funding).
|
Fund
|
Adopted Budget
|
Proposed Variations
|
Proposed Budget
|
|
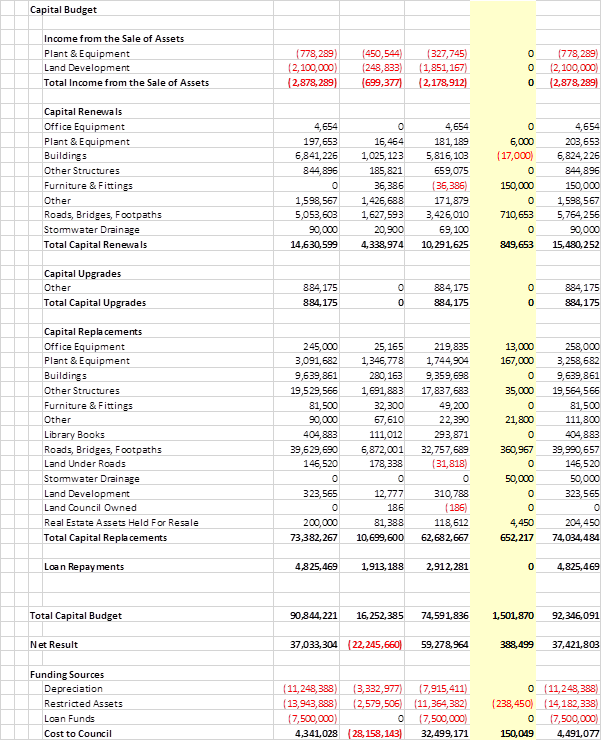
General
|
4,341,028
|
150,049
|
4,491,077
|
|
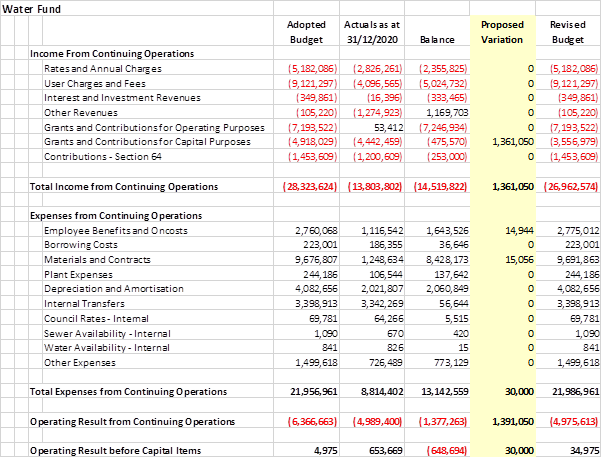
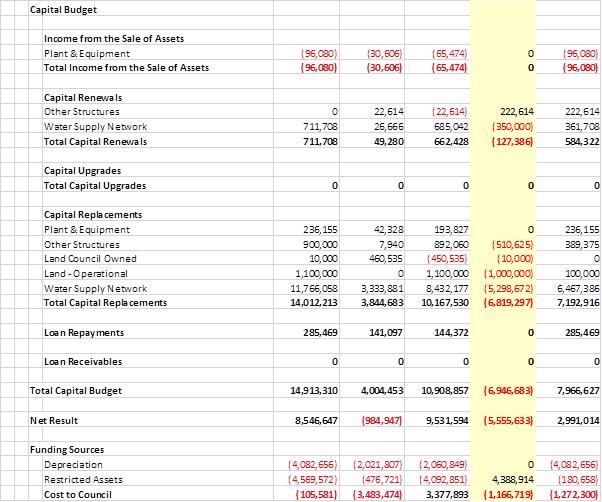
Water
|
(105,581)
|
(1,166,719)
|
(1,272,300)
|
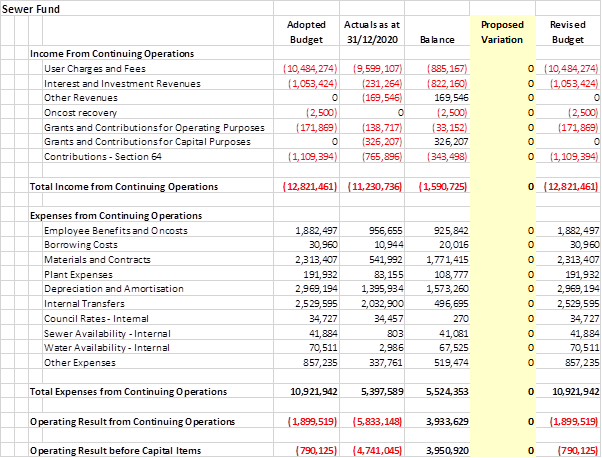
|
Sewer
|
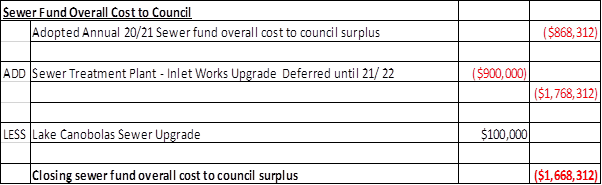
(868,312)
|
(800,000)
|
(1,668,312)
|
|
Total
|
3,367,135
|
(1,816,670)
|
1,550,465
|
Table 2: Projected year-end
position by Fund
Table 3 presents Council’s
projected year-end Operating Result (before capital) by Fund.
|
Fund
|
Adopted Budget
|
Proposed Variations
|
Proposed Budget
|
|
General
|
3,691,189
|
(163,371)
|
3,527,818
|
|
Water
|
4,975
|
30,000
|
34,975
|
|
Sewer
|
(790,125)
|
0
|
(790,125)
|
|
Total
|
2,906,039
|
(133,371)
|
2,772,668
|
Table 3: Projected year-end
operating result by Fund
Material
changes to budget in the December quarterly review
Further information on the individual variations proposed as
part of this review, which have a material effect on Council’s financial
results, is detailed in Tables 4 to 9 below.
While there are a number of variations detailed in the
Tables, the significant contributors to the overall net variation are the
deferment of several water and sewer capital projects. Four new positions have
been added to the budget with recruitment to happen if this quarterly report is
resolved by Council. The new positions are a conversion of casual staff to a
permanent part time assistant at the animal shelter, conversion of two
temporary roles to permanent part time roles at the Caravan Park and a
permanent part time swim schools program coordinator at the aquatic centre.
There is minor budgetary impact in the current financial year however the
positions are ongoing and included in the structure going forward.
Table 4: General Fund
Operating Result
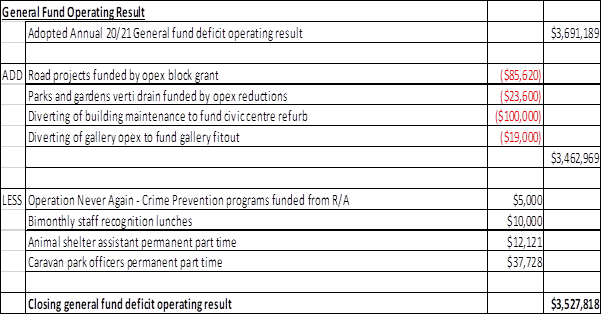
Table 5: General Fund
Overall Cost to Council
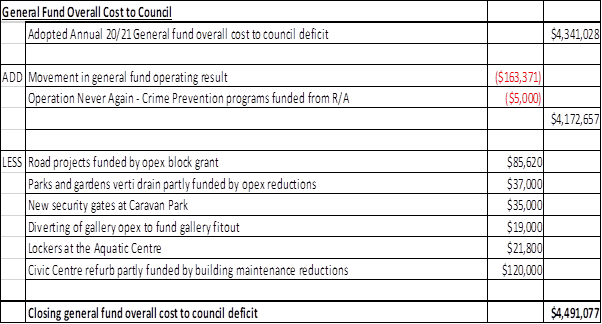
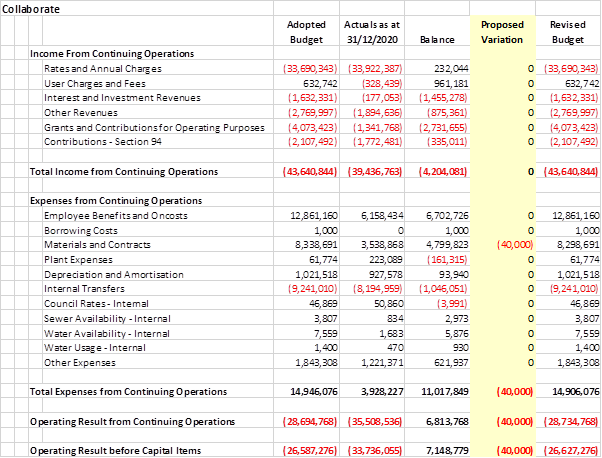
Table 6: Water Fund
Operating Result
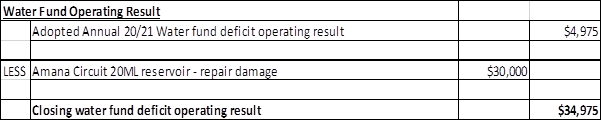
Table 7: Water Fund Overall Cost to Council
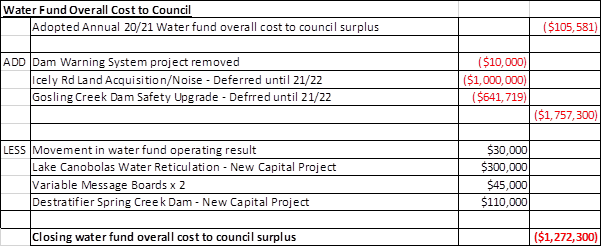
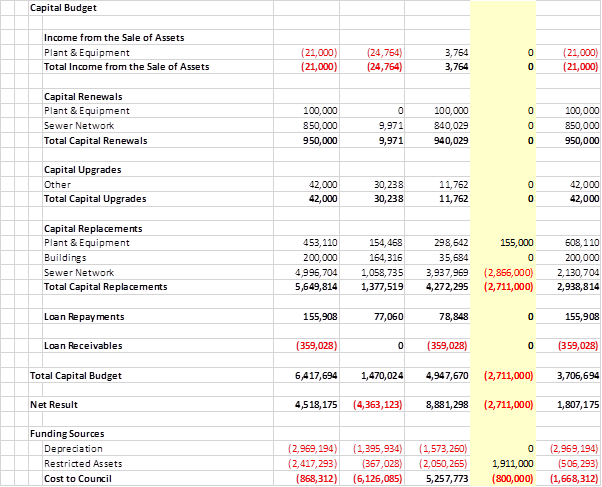
Table 8: Sewer Fund
Operating Result
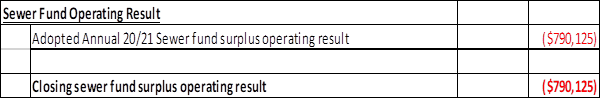
Table 9: Sewer Fund Overall
Cost to Council
Policy and Governance Implications
Nil
|
Recommendation
That Council resolves:
1 That
the information provided in the report on the quarterly budget and
performance indicators review for October 2020 to December 2020 be
acknowledged.
2 The
bank reconciliation statement be acknowledged.
3 To
adopt favourable variations in the consolidated overall cost to council
arising from the December 2020 quarterly review amounting to $1,816,670.
|
further considerations
The recommendation of this report has been assessed against
Council’s other key risk categories and the following comments are
provided:
|
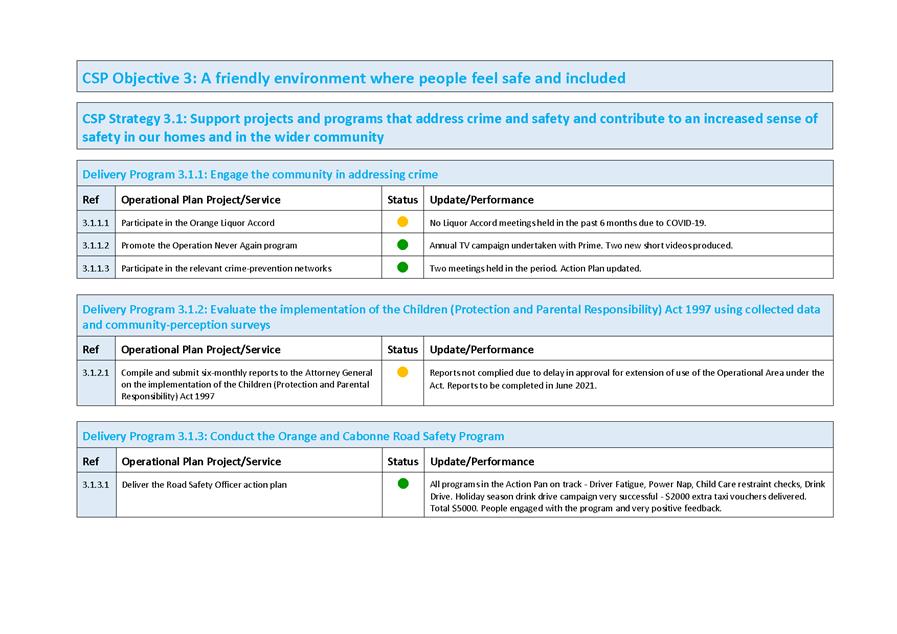
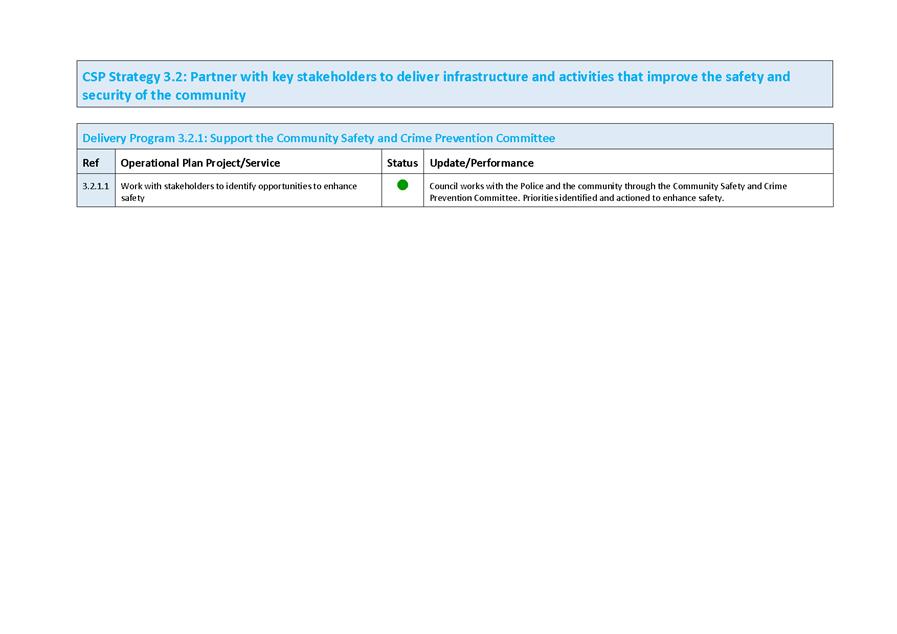
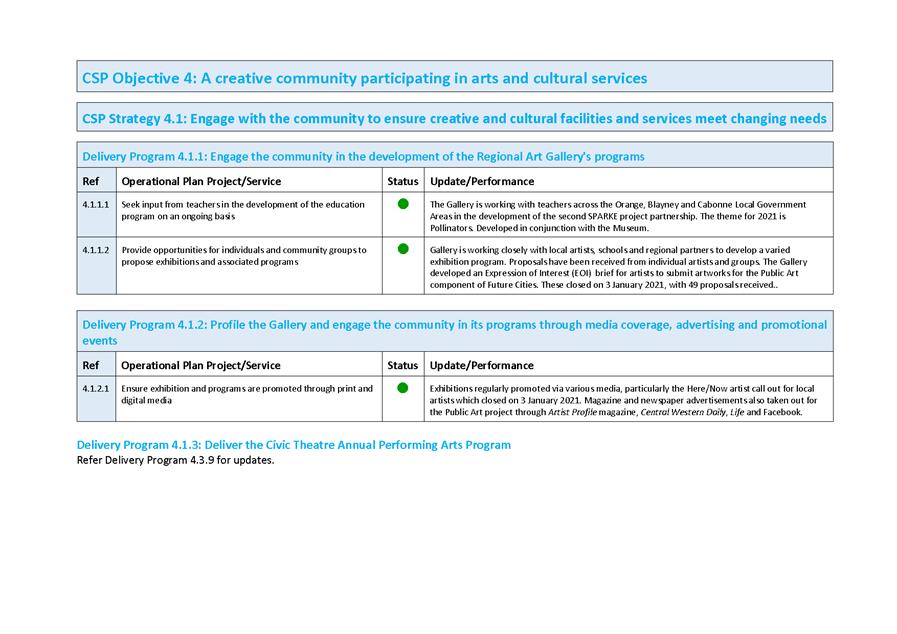
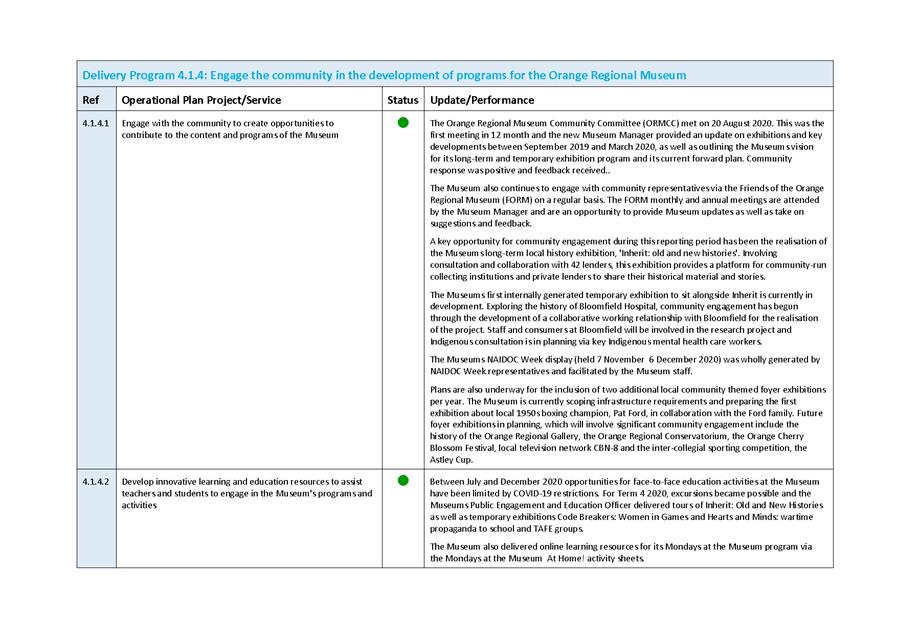
Service Delivery
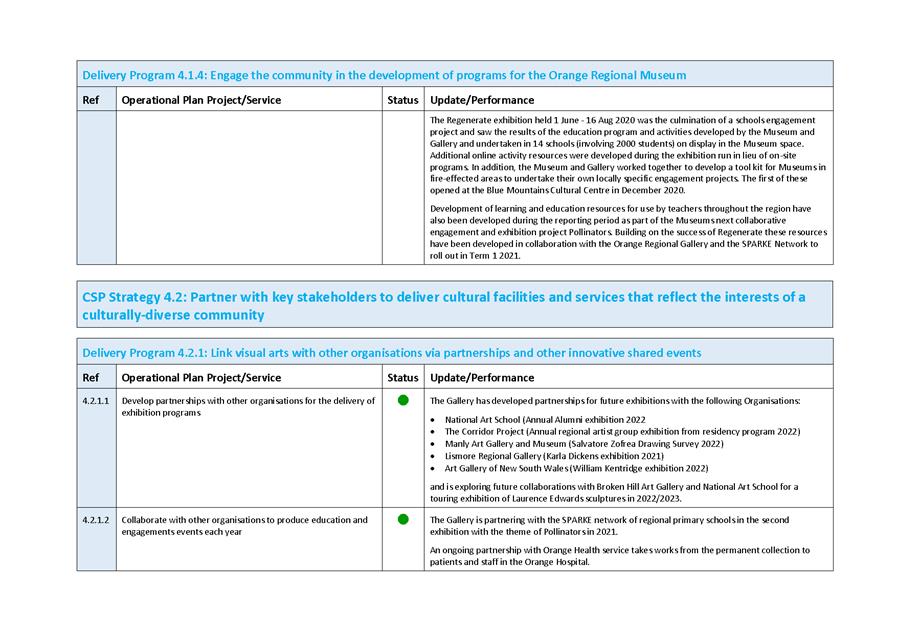
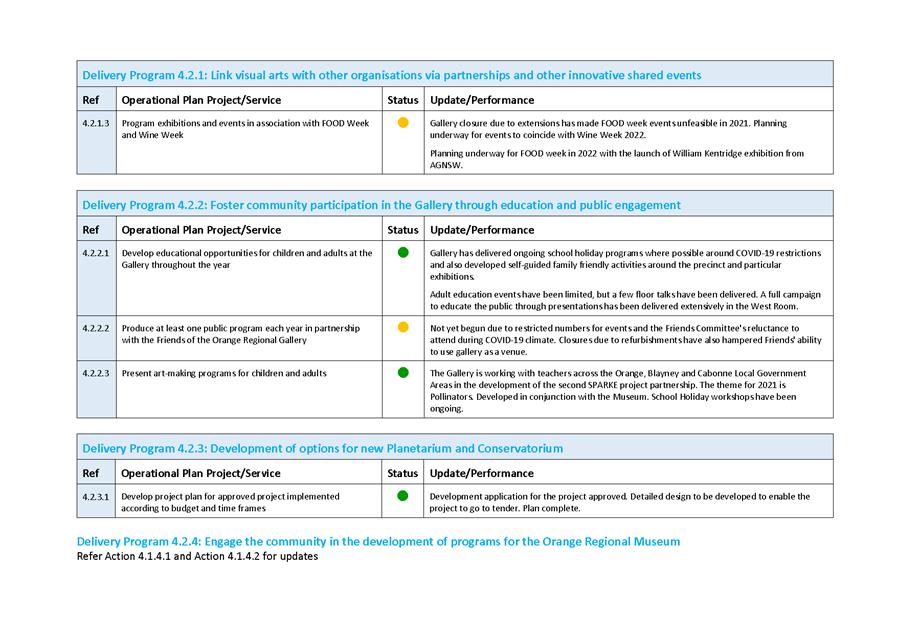
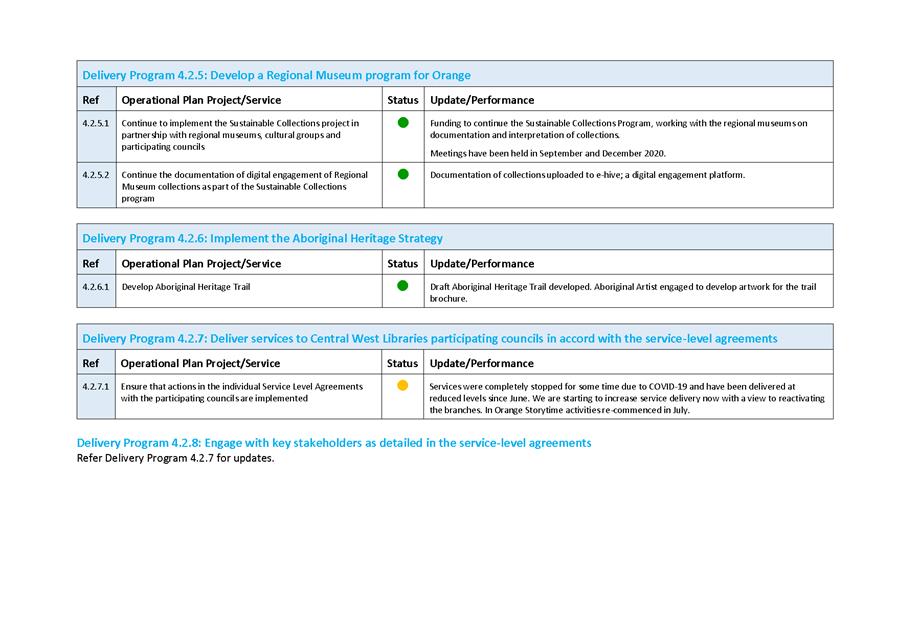
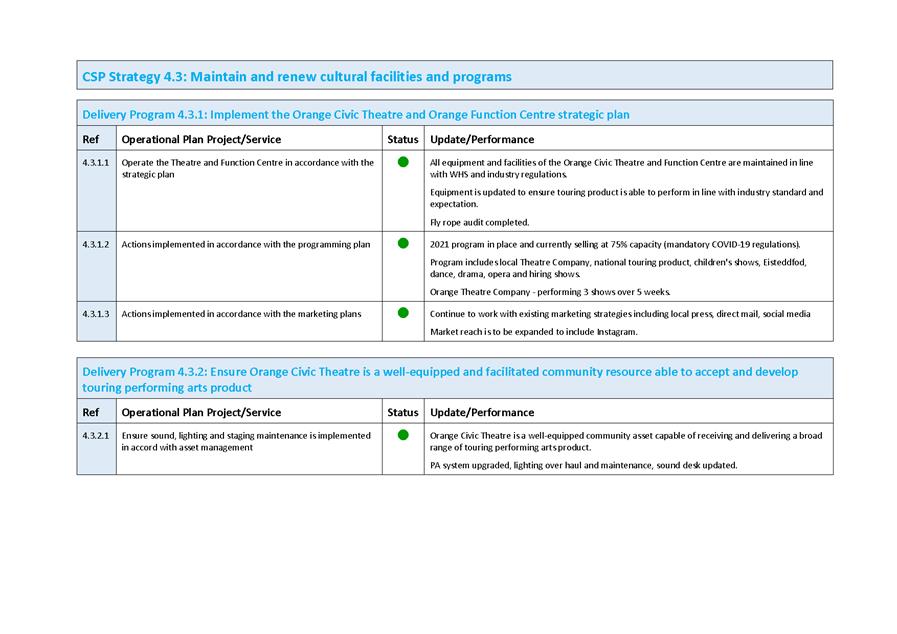
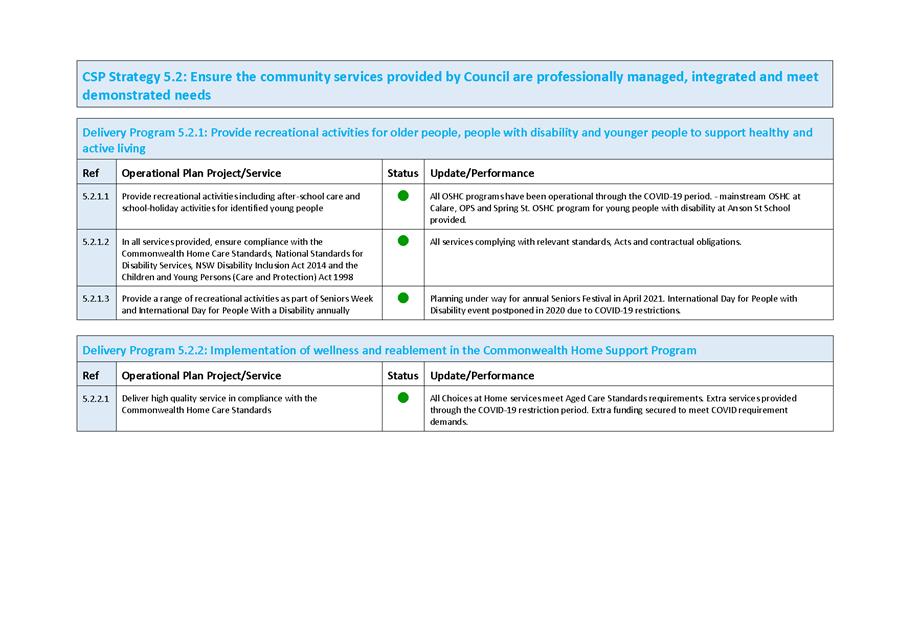
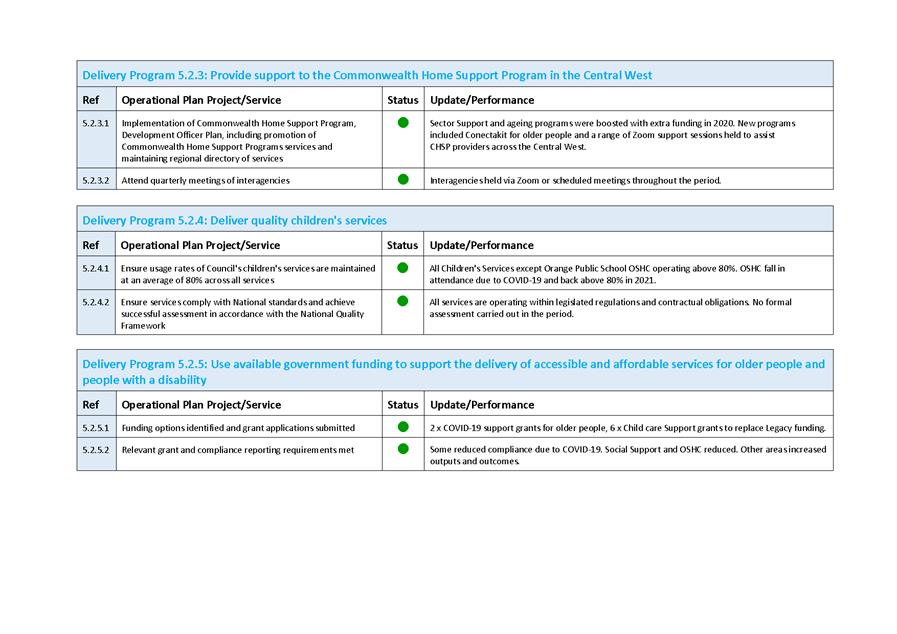
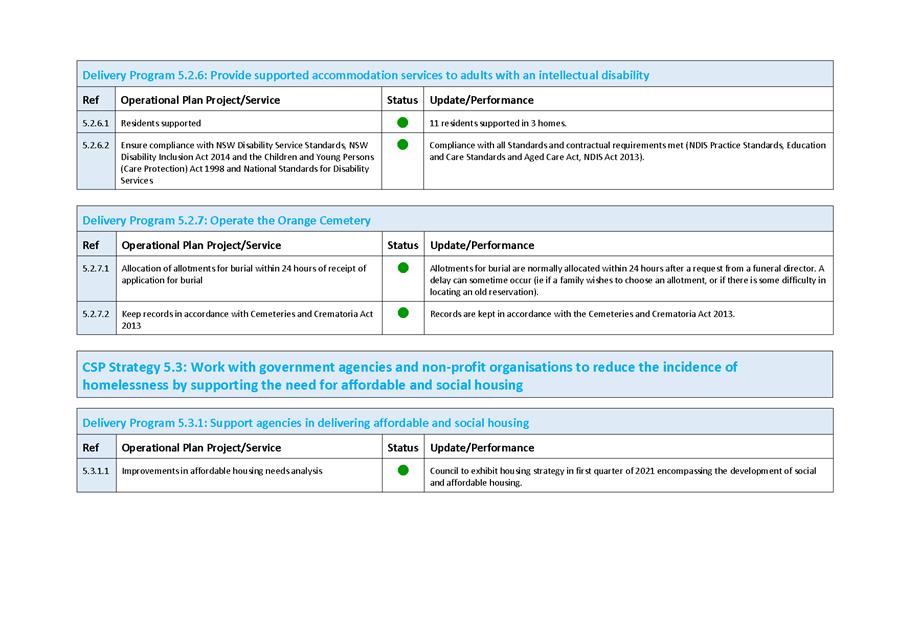
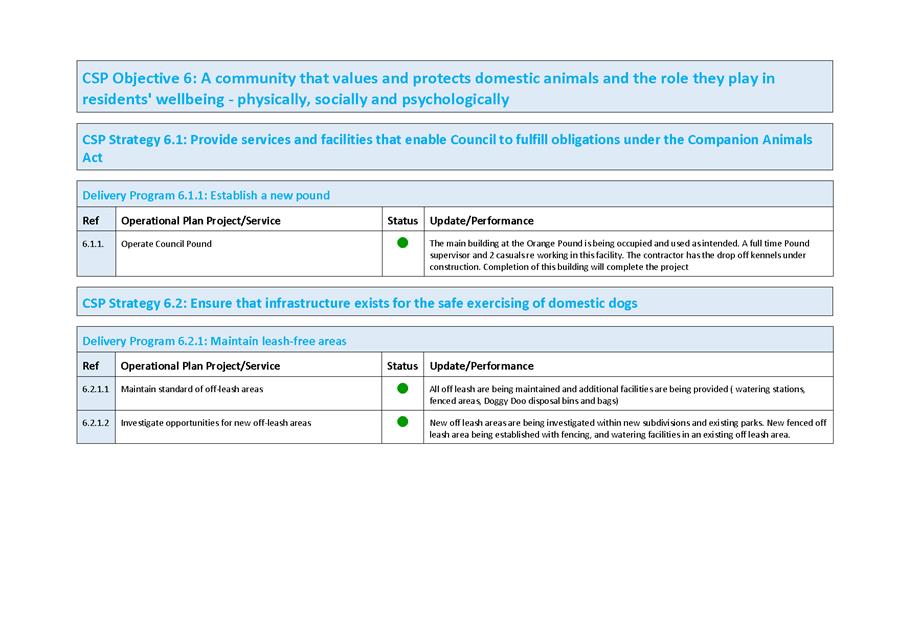
|
The Performance Indicators
highlight progress in achieving the strategies and actions set by
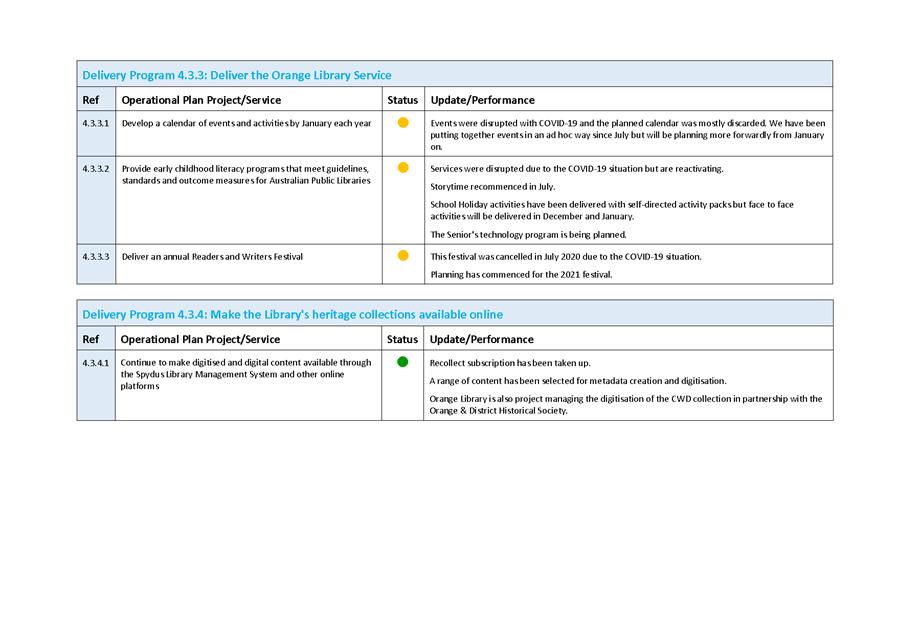
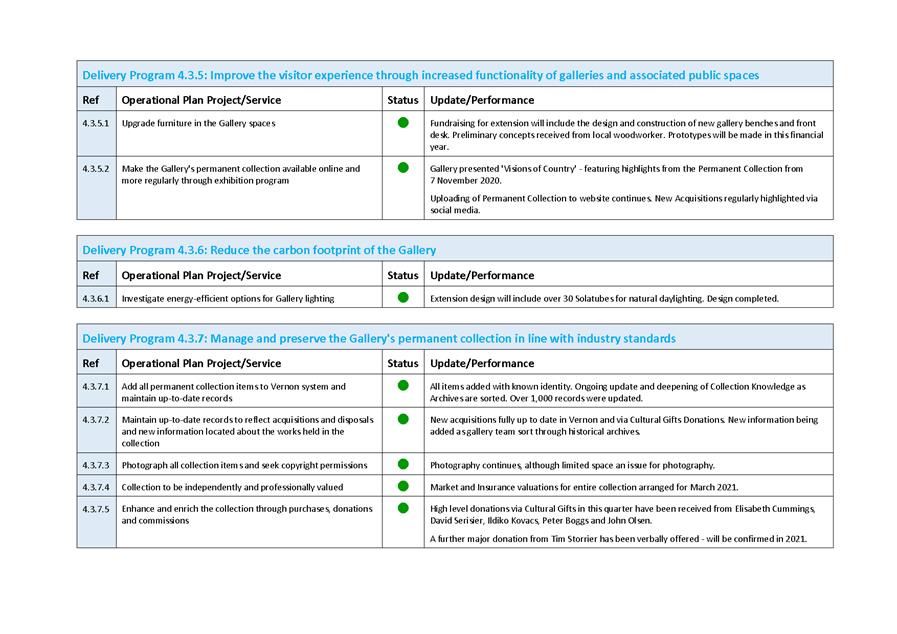
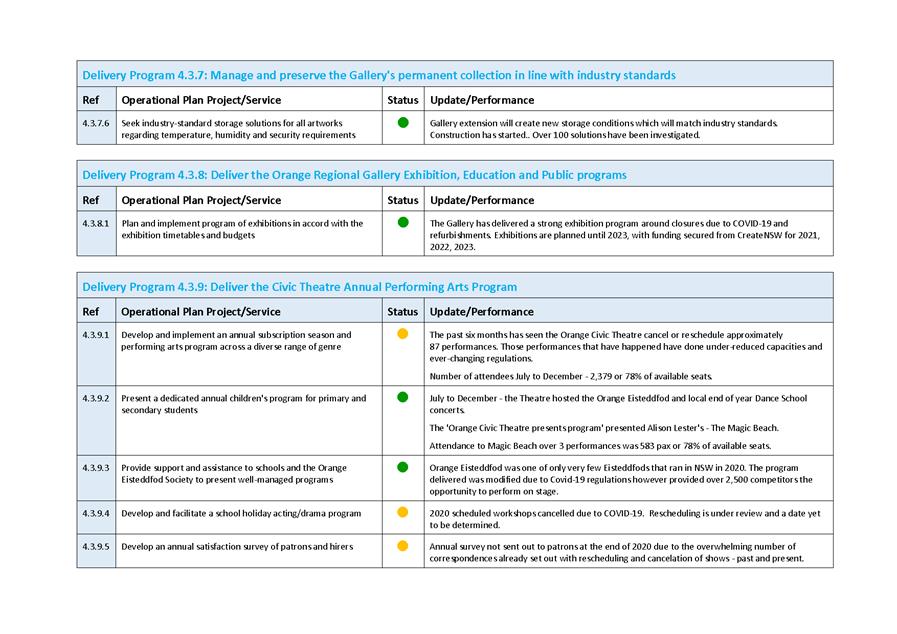
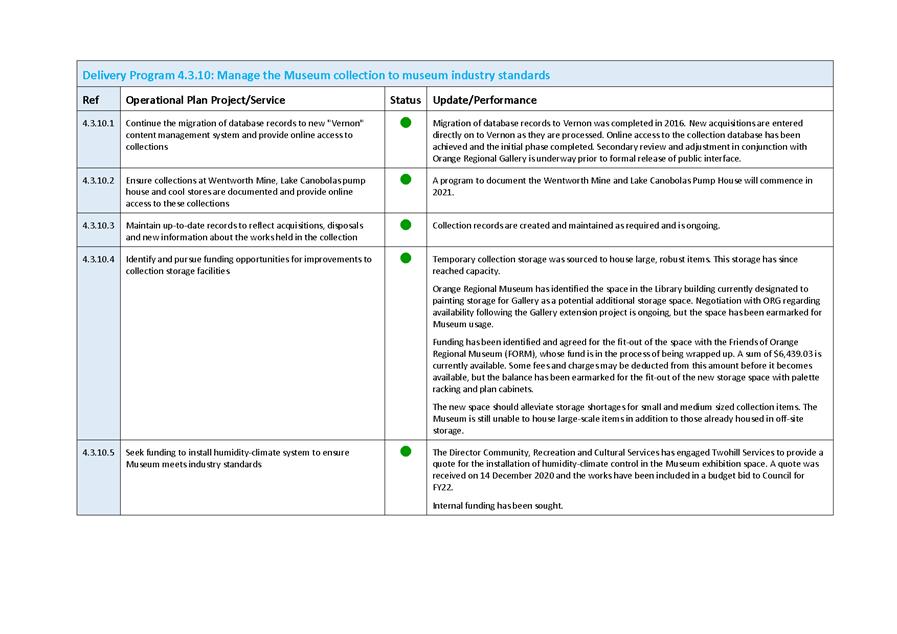
Council’s Delivery/Operational Plan. The “traffic light”
indicators show the status of each task. A green light indicates the task is
on track. An amber light suggests some delay and a red light is provided to
those tasks that are unable to be achieved. All tasks have a comment that
indicates progress.
|
SUPPORTING INFORMATION
Highlights of the Quarter
· Work
began on the Orange Regional Gallery’s $5 million extension after a
sod–turning event attended by the NSW Arts Minister Don Harwin. The
extension is funded by the NSW Government’s Regional Cultural Fund
($4,052,990) and Orange City Council ($1,000,000) with community contributions.
· There
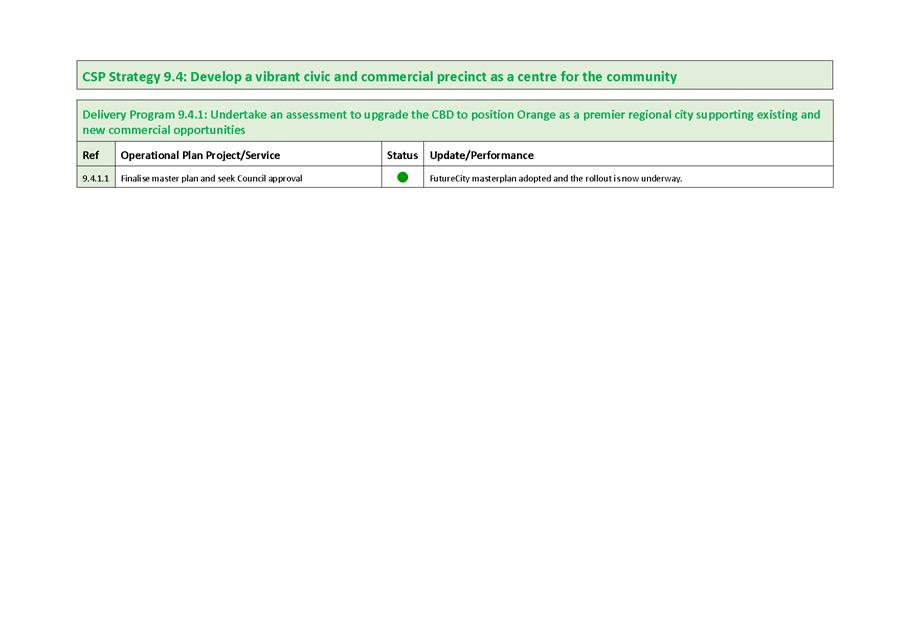
was activity on the FutureCity program:
o A series of community
information sessions were held to keep the community in touch with unfolding
aspects of the Future City plans to upgrade the CBD. Sessions were held with
residents and members of the business community.
o Among the first changes in
places were large heritage images fitted to the windows of vacant shops in a
bid to revitalise the streetscape and make walking in the centre of town more
enjoyable for locals and visitors alike.
o The $1.5 million Future City
‘Whiteway’ project, an upgrade of footpath lighting in Summer
Street, was turned on. Council and community leaders were on hand on to see the
automatic lights switch on for the first time on 30 October.
o As part of Future City,
Council funded up to $50,000 worth of Christmas decorations to beautify the
area and brighten people’s sprits. The extra spend on Christmas decorations
was in lieu of the annual Carols by Candlelight event which could not go ahead
because of Coronavirus restrictions.
· The
lack of international holiday options led to increased numbers of tourists in
Orange. A record number of travellers entered the Orange Visitors Centre over
the October long weekend, more than double the number from the previous year.
· Water
Polo returned to the line-up of activities at the Aquatic Centre. COVID safe
games were arranged and there was a boost in registrations ahead of its season
opening.
· The
appointment of an expert consultant and a community survey was part of plans to
develop a new guide to the future management of flying foxes.
· Work
continued on a number of major road projects:
o Work began on an upgrade of
Ploughmans Lane, between Coronation Drive and Escort Way.
o Congestion on the Northern
Distributor eased when the $5.5 million roundabout at Hill Street and William
Maker Drive opened to traffic.
o Work has begun on the $7.5 million
next stage of Orange’s southern feeder road. Community leaders gathered
for a brief ceremony to signal the start of work.
· Council
supported plans to take the annual NYE celebrations in a new direction,
replacing fireworks with a major laser show at Wade Park.
· With
total water storage levels hovering around 60 per cent and Orange on Level 2
water restrictions, Council adopted permanent water saving standards,
regardless of the city’s water storage level. The permanent water saving
standards come into effect when the combined water storage level reaches 80 per
cent.
· A new
fence was built around the arena at Orange Showground, aimed at making the
facility safer and more secure for users. The arena is used for the annual
Orange Show, and doubles as a leash-free pet exercise area.
· There
were efforts to boost awareness of a system to help curb incidents of vandalism
in the city. The Council program aims to reward people for information leading
to the conviction of anyone found vandalising.
· Wade
Park was boosted by two new upgrades:
o The cutting of a ribbon
signalled the completion of the state’s latest ‘Cricket &
Community Centre’. The new $3.4 million indoor cricket centre will host
training and educational facilities.
o 698 new grandstand seats were
installed at Wade Park courtesy of a $100,000 grant from the Australian
Government.
· Work
began on a major environmental investigation of Mount Canobolas to see if a
network of mountain bike tracks can be built that are sympathetic to the
environment. The investigation is the latest milestone in a long-running
proposal to make Orange a hub for mountain bike enthusiasts.
· The
first stage of plan for a new sporting precinct, which includes removing trees
on a site alongside Sir Jack Brabham Park, went on-show for community comment.
Due to the size of the $25 million dollar development, planning approval for
the project is being handled progressively in stages.
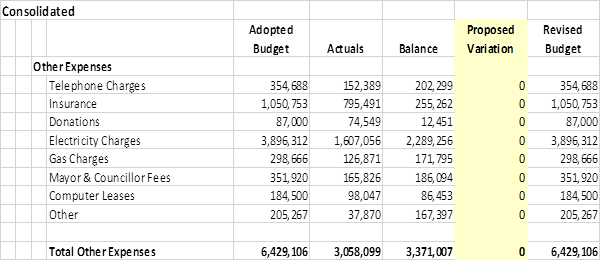
Other Expenses
The format of the attached financial reports and the financial
statements is prescribed. Council has requested details of the
“Other Expenses” element in the statements given the high value of
this item. The additional information is provided in Table 9 below. As at the
end of December 2020, actual expenses were on track at 48 per cent of the
annual budget.
Table 9: Details of other
expenses
Review
of Income
Figure 1 below provides a snapshot of the split of
Council’s income against budget.
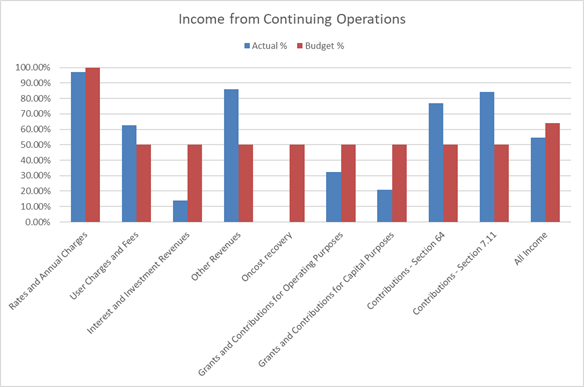
Figure 1: Council’s
income as a percentage of annual budget as at 31 December 2020
Income streams such as User Charges and Fees and Other
Revenues are currently slightly above budget but generally their rate of
receipt is consistent throughout the year.
As Council’s annual rates are levied in July of each
year, this income is almost fully recognised in the first quarter.
Other income streams are subject to external influences
including interest rates, occurrences of development, or the success of grant
applications. These income streams are routinely reviewed, and adjusted as
appropriate, at each quarterly review.
On the assumption that all income is received at a constant
consistent rate over the year, by the end of the December quarter 50 per cent
should have been received. However, given the recognition of almost all rates
and annual charges in the first quarter, approximately 64 per cent of revenue
should have been received. The “all income” bar of Figure 1
shows progress is slightly below this expected figure due mainly to the timing
of interest due and grants and contributions not yet received.
Rates and Charges Collection
For the quarter, a total of $5.4 million (13.7 per cent)
remained outstanding for rates and annual charges. For the purposes of
comparison, for the same quarter last financial year 13.4 per cent of the
amount payable remained outstanding.
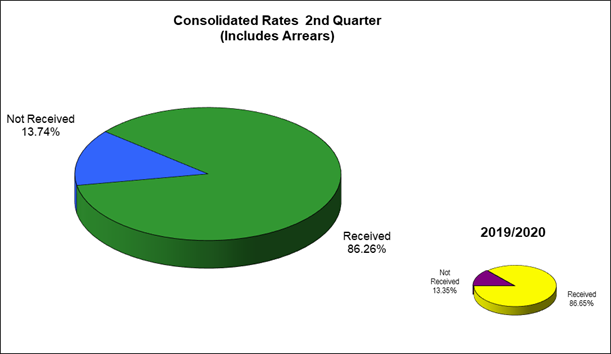
Figure 2: Outstanding rates
Q2 2020/21 vs Q2 2019/20
Review of Operating Expenditure
Figure 3 provides a snapshot of
the progress of Council’s operating expenditure.
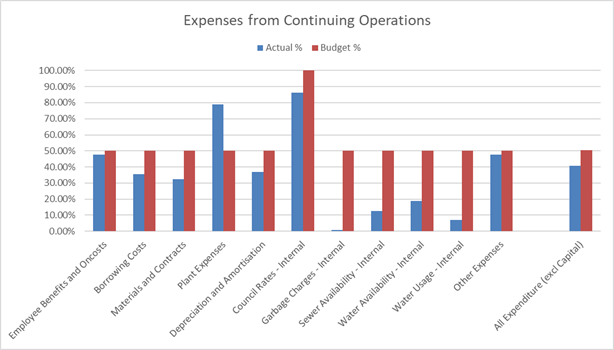
Figure 3: Details of
Council’s expenditure as a percentage of annual budget as at 31 December
2020
In general, Council’s routine operational expenses
should be incurred at a consistent rate. These include expense groupings such
as Employee Costs, Materials and Contracts, Plant Expenses, Depreciation and
Other Expenses. As presented in Figure 3 above, most of these expense groups
are slightly below budget.
Council rates for Council-owned properties are paid in full at
the start of the year, however these are a minor component of overall expenses.
On the assumption that all expenses are incurred at a constant
consistent rate over the year, by the end of the December quarter 50 per cent
should have been paid out. The “all expenditure” bar of Figure 3
shows performance is better than budget.
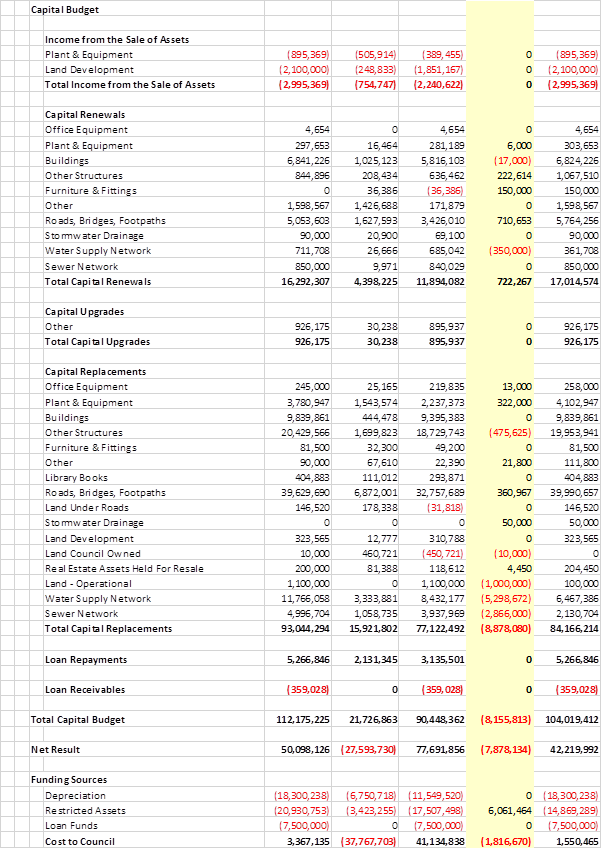
Review of Capital Expenditure
Figures 4 to 6 below provide a
snapshot of the progress of Council’s capital expenditure against budget
by fund. It is important to note that the first half of the year encompasses a
lot of planning and preparation, with many projects not scheduled to be in full
swing until Summer, while others are still awaiting confirmation of grants
being secured before being able to proceed.
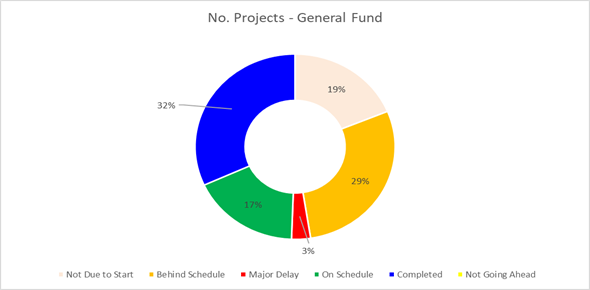
Figure 4: General Fund
Capital Projects – Progress by number of projects as at 31 December 2020
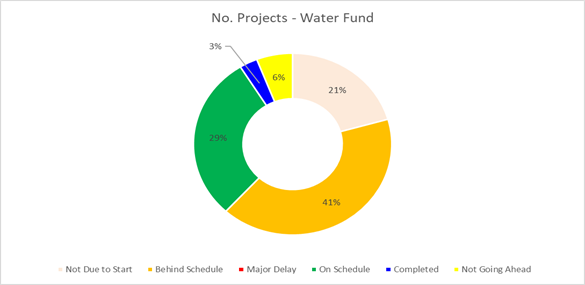
Figure 5: Water Fund
Capital Projects – Progress by number of projects as at 31 December 2020
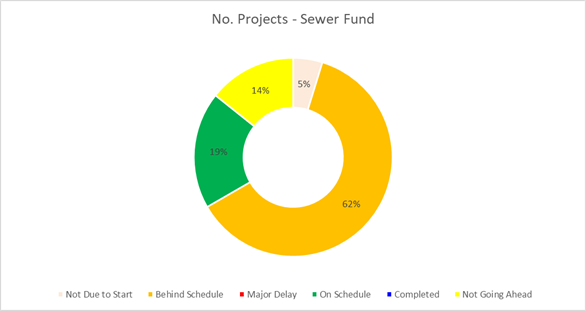
Figure 6: Sewer Fund
Capital Projects – Progress by number of projects as at 31 December 2020
Financial
Performance Indicators
Figures 7 to 9 below represent
financial performance against local government industry indicators from the
annual financial statements. The charts compare annualised actual performance
from 2019/20 against the original 2020/21 budget and the proposed Q1 revised
2020/21 budget.
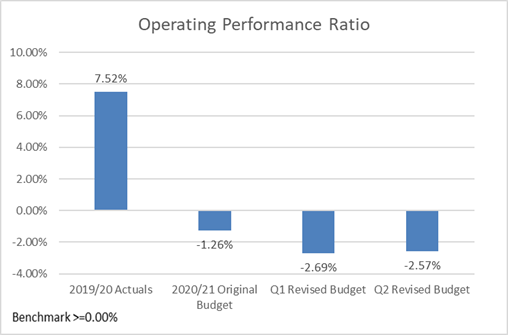
Figure 7: Operating
performance ratio
The purpose of the operating performance ratio is to measure
the extent to which Council succeeds in containing operating expenditure within
operating revenue (excluding capital grants and contributions). The formula is
as follows:
(Total continuing operations revenue excluding capital
grants and contributions minus operating expenses) divided by (Total
continuing operations revenue excluding capital grants and contributions)
The performance to date indicates Council is tracking below
the benchmark due mainly to the forecast operating deficit for the 2020/21 year
when compared to the operating surplus achieved in 2019/20.
Figure
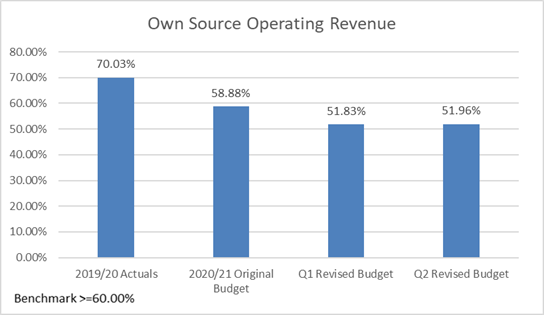
8: Own source operating revenue ratio
The purpose of the own source
operating revenue ratio is to measure fiscal flexibility by analysing the
degree of reliance on external funding sources. The formula is as follows:
(Total continuing operations revenue minus all grants
and contributions) divided by
(Total continuing operations revenue inclusive of all
grants and contributions)
The performance to date indicates Council is below the
benchmark, with a significant increase in the level of funding expected to come
from capital grants and contributions for major projects in 2020/21.
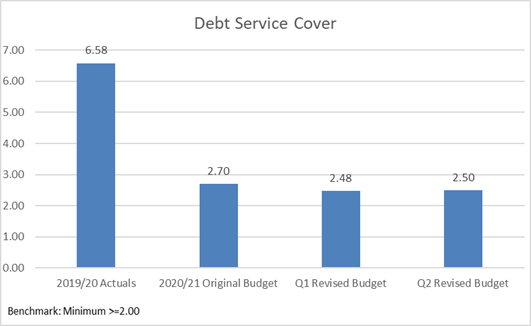
Figure 9: debt service
cover ratio
The purpose of the debt service cover ratio is to measure the
availability of operating cash to service debt including interest, principal
and lease payments. The formula is as follows:
(Operating results before capital excluding interest
and depreciation) divided by
(Principal repayments from the cashflow statement plus
borrowing costs from the income statement)
The performance to date indicates Council is tracking in
advance of the benchmark. The budgeted performance is below the 2019/20 ratio
due to the surplus operating result achieved in 2019/20 combined with lower
loan repayments and interest than is forecast for 2020/21.
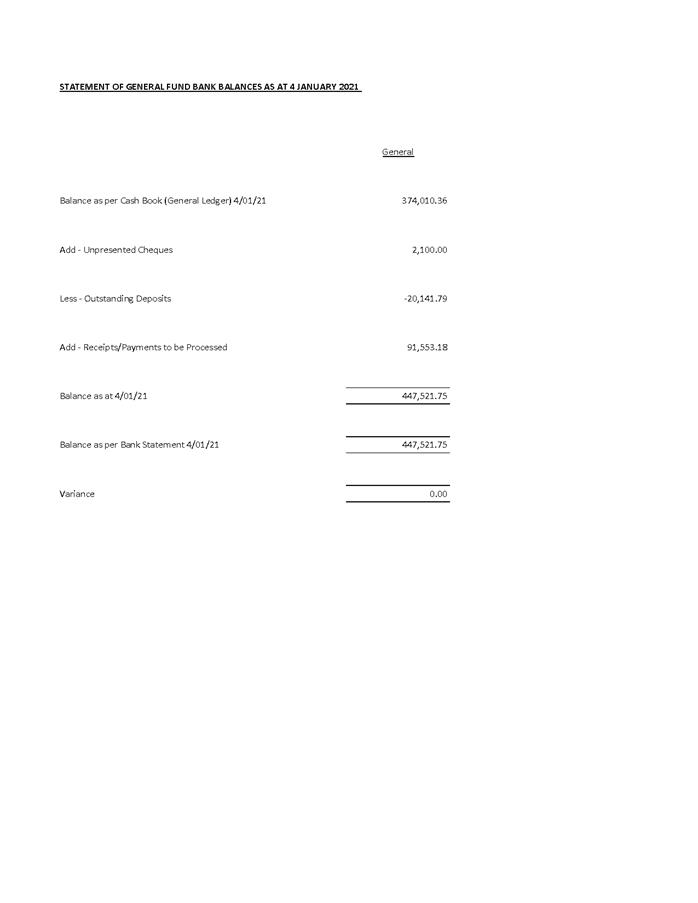
Bank
Reconciliation
In addition to the information presented in the report, the
latest bank reconciliation report is attached for Council’s information.
Report by Responsible Accounting Officer
The following statement is made in accordance with Clause
203(2) of the Local Government (General) Regulation 2005:
As
the Responsible Accounting Officer, it is my opinion that the Quarterly Budget
Review Statement for Orange City Council for the quarter ended 30 September
2019 indicates that Council’s projected financial position for 30 June
2020 will be satisfactory having regard to the project estimates of income and
expenditure, and variations contained therein.
Jason
Cooke, Responsible Accounting Officer
Attachments
1 December
2020 Quarterly Bank Reconciliation, D21/3089⇩
2 December
2020 Quarterly Review, D21/3085⇩
3 Progress
Report - 2018/22 Delivery Program (Year 3) - Operational Plan 2020/2021 - First
Six Months (1 July 2020 to 31 December 2020), D21/4019⇩