2 General
Reports
TRIM
REFERENCE: 2017/1955
AUTHOR: Kathy
Woolley, Director Corporate and Commercial Services
EXECUTIVE Summary
This report provides Council with information from the Evocities
campaign.
Link To Delivery/OPerational Plan
The recommendation in this report relates to the Delivery/Operational
Plan strategy “11.1 Our Economy – Encourage the
growth of local business, support emerging industry sectors and attract new
investment to Orange”.
Financial Implications
Council contributed $70,000 for the 2017/18 membership.
Policy and Governance Implications
Nil
|
Recommendation
That Council note the Evocities 2016/17 outcomes and
update on the 2017/18 program.
|
further considerations
Consideration has been given to the
recommendation’s impact on Council’s service delivery; image and
reputation; political; environmental; health and safety; employees;
stakeholders and project management; and no further implications or risks have
been identified.
SUPPORTING INFORMATION
Evocities has supplied the
following information for Council’s information.
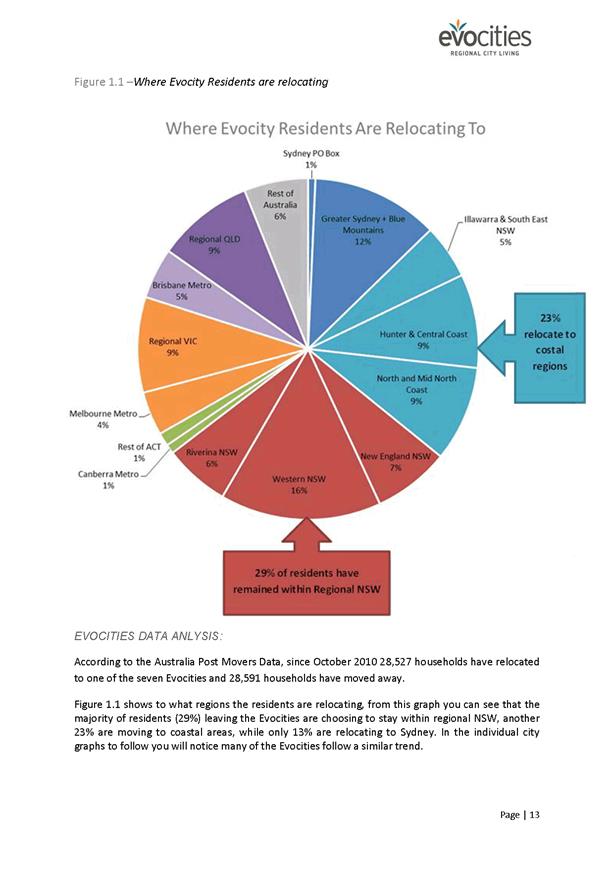
Since its launch in September 2010, Evocities has
recorded over 3,100 households as having relocated to one of the seven cities.
The campaign has generated over 6,200 relocation enquiries; the Evojobs website
has advertised over 37,000 local jobs, resulting in 2 million sessions on the
site; and Evocities generated 2,694 media placements.
Evocities.com.au
Over 368,000 people have visited the Evocities website
since its launch in September 2010. This past year (2016/17) saw the highest
level of web traffic in the marketing campaign’s seven year history.
· Website traffic (sessions) to Evocities.com.au
increased by 4% (98,130).
· 70,034 people visited the site and 70% of these people
(49,023) were visiting the site for the first time.
· 67% of all Australian traffic originated from Sydney
based locations.
· There was a significant increase from Melbourne
sources – up by 9,685 sessions or 223%.
· 38% found the site through Organic Search (typing
Evocities into a search engine) and Direct (typing Evocities.com.au into the
address bar), up from 29% the previous year.
The Organic Search and
Direct traffic is still making up a high percentage of all web sessions which
indicates good brand awareness reinforced by the combination of
Evocities’ traditional and digital advertising. Visitation from these two
channels always represents the highest quality of traffic with time spent on
the site always much higher than other sources.
Evojobs.com.au
The new Evojobs website went live in January 2017 and the
site was officially launched in March. Merging the seven Evocities job sites
into a single platform improved the site’s capabilities, expanded its
reach and further enabled the site to be utilised in leveraging the
availability of current jobs to attract skilled relocators. Radio and bus
advertising for Evojobs.com.au resulted in both the Evocities and Evojobs
website receiving increased traffic:
· There were 6,430 job vacancies listed in the 2016/17
year.
· The average number of jobs posted each month is 535.
· Since September 2010, there have been 37,783 job
vacancies listed on the Evojobs site/s.
· Since the new site went live in January 2017 to June
2017, 41% of all users return to the site.
· The Evocities website pushed 11,692 sessions to the
Evojobs site over this 6 month period.
Public Relations and Media
In 2016/17 Evocities
received a total of 30 national and metropolitan placements, and 107 regional
media placements.
Website and Media Statistics:
|
Statistic
|
2016/17
|
Total
(cumulative)
|
|
No. of sessions on
evocities.com.au
|
98,130
|
521,626
|
|
No. of sessions on
evojobs.com.au
|
272,874
|
2,000,211
|
|
No. of media placements
|
137
|
2,707
|
|
Total potential audience
reach
|
17,262,430
|
135,026,677
|
Marketing
In July 2016 Evocities launched its new advertising
campaign, which involved:
· Ambassador videos featured on YouTube and Facebook
· Radio advertising for three weeks in August 2016
· The radio campaign’s success was evident with a
marked increase in website traffic with 5,348 sessions in the three weeks of
the campaign from 14 August to 3 September 2016, which was an increase of
60.75% on the previous period, and the organic search traffic increased by 100%
from 933 to 1866.
· Billboards installed at two major railway platforms in
the Sydney CBD from the beginning of September 16 and advertising on two buses
in the West Sydney area.
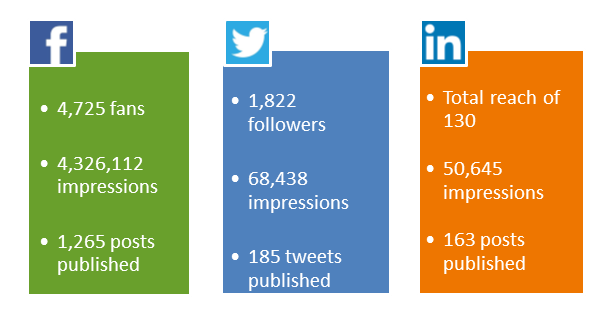
Social Media
Information below shows Facebook, Twitter and LinkedIn
outcomes for 2016/17.
· Facebook - The page made 4,326,112 impressions,
321,811 of these were organic. 58,041 post engagements were recorded, including
7,493 reactions and 998 comments.
· Twitter - The Evocities Twitter account received 93
mentions and its followers increased by 4.7% in the 2016/17 year. .
· LinkedIn - 866 engagements. In 2016/17 followers
increased by 41.3% to 130.
Impact
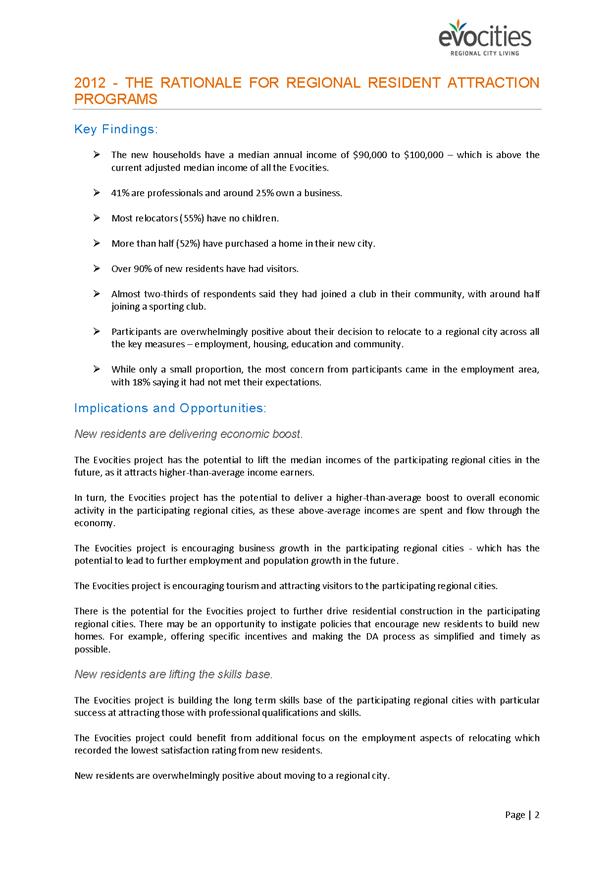
In January 2012, research was conducted to estimate the
economic benefits to the Evocities of attracting new residents. This research
found that the relocated households had a median annual income of $90,000 to
$100,000, which was above the adjusted median income of all the Evocities. It
was reported that Evocities has the potential to lift the median incomes of the
participating regional cities in the future, as it attracts higher-than-average
income earners and those with professional qualifications and skills. In turn,
the Evocities project has the potential to deliver a higher-than-average boost
to overall economic activity in the participating regional cities, as these
above-average incomes are spent in the regions and are further boosted by the
multiplier effect.
Evocities began sending ‘Welcome Home to your new
Evocity’ postcards to new residents in December 2016. Since this time,
responses have been received from 152 households that have recently relocated
to an Evocity. Details gained from the respondents have been useful in the
organisation of welcome events and identifying potential case studies. Of the
152 relocators to date 30% said they were familiar with Evocities.
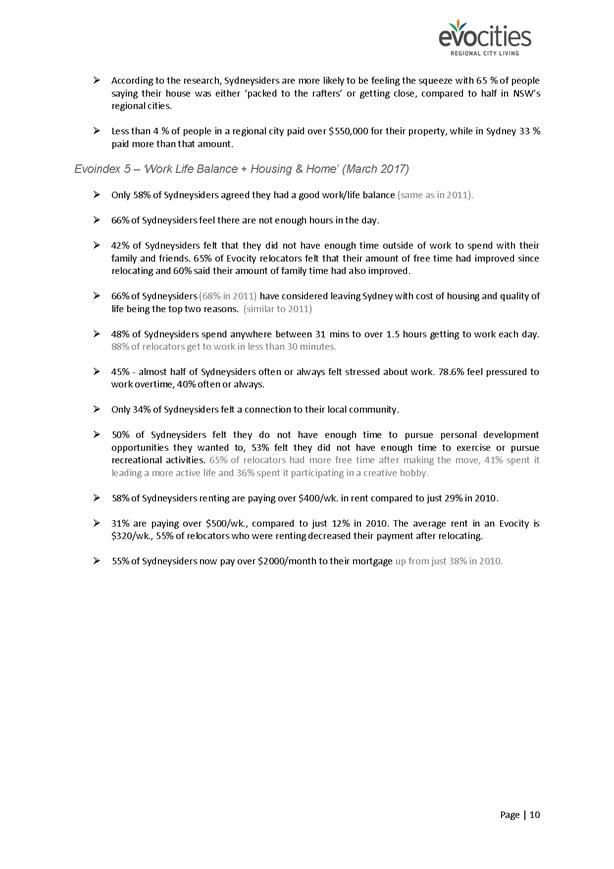
The Evoindex research conducted in March 2017 found:
· 66% of Sydneysiders have considered leaving Sydney
with cost of housing and quality of life being the top two reasons.
· 48% of Sydneysiders spend anywhere between 31 mins to
over 1.5 hours getting to work each day, while 88% of relocators get to work in
less than 30 mins after moving.
· Only 34% of Sydneysiders felt a connection to their
local community.
· 58% of Sydneysiders renting are paying over $400/wk.
in rent compared to just 29% in 2010.
· 31% are paying over $500/wk., compared to just 12% in
2010. The average rent in an Evocity is $320/wk., 55% of relocators who were
renting decreased their payment after relocating.
· 55% of Sydneysiders pay over $2000/month to their
mortgage, up from 38% in 2010.
|
Statistic
|
2016/17
|
Sep 2010 to
Jun 2017
|
|
Number
of families (households) who have relocated
This figure represents the number of households who relocated to
an Evocity and directly confirmed their move with that Evocity (through the
Evocities website or with Council customer service for example).
|
325
|
3,100
|
|
Number
of families (households) indicating their intention to relocate
|
329
|
1,805
|
|
Number
of direct enquiries to councils from potential new residents
|
717
|
6,251
|
|
Number
of new resident / business / investment case studies submitted
|
36
|
255
|
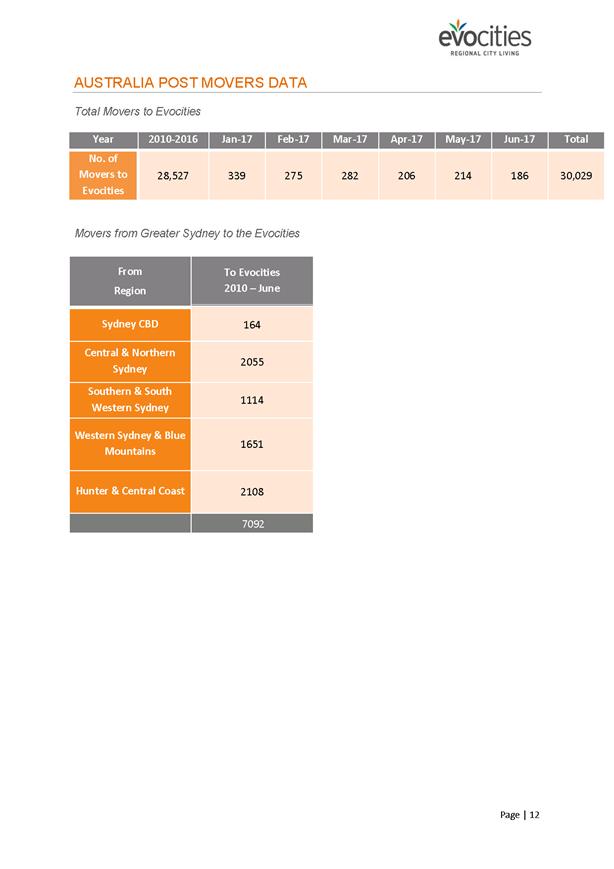
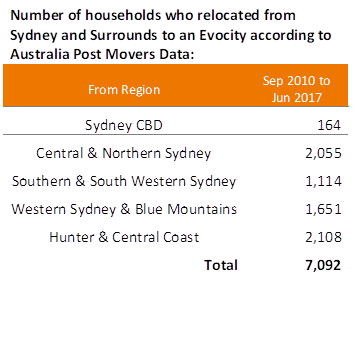 Australia Post Movers Data
Number
of households who relocated to an Evocity according to Australia Post Movers
Data:
|
Period
|
Number
|
|
July 2016
|
259
|
|
August 2016
|
273
|
|
September 2016
|
247
|
|
October 2016
|
227
|
|
November 2016
|
246
|
|
December 2016
|
333
|
|
January 2017
|
339
|
|
February 2017
|
275
|
|
March 2017
|
282
|
|
April 2017
|
206
|
|
May 2017
|
214
|
|
June 2017
|
186
|
|
Total for 2016/17
|
3,087
|
|
September 2010
to June 2017
|
30,029
|
2017/18
aCTIVITIES
NSW Government Funding - In July 2017 Evocities received
a $300,000 grant under the NSW Government’s Regional Growth –
Marketing and Promotion Fund. These funds will be used to reach a mass audience
including Melbourne, Brisbane and Canberra throughout July to December 2017.
The main activities will include:
· Radio
advertising in Sydney, Melbourne, Brisbane and Canberra (four months, two
stations per city) and traffic report and news bulletin sponsorship in Sydney
through the Australian Traffic Network (ATN);
· Large scale
billboards on M4 and M5 motorways (four months); and
· Digital
advertising into Sydney, Melbourne, Brisbane and Canberra using Facebook,
YouTube, and search and display advertising.
· The billboards
were installed and the ATN sponsorship commenced on 6 August 2017 and the radio
ads began airing on 14 August 2017. Since this time the traffic to the
Evocities and Evojobs websites saw instant increases in traffic and engagement.
The following statistics report
the 31 days since the mass advertising commenced (6 Aug 17 to 5 Sep 17)
compared to the previous period (6 Jul 17 to 5 Aug 17):
|
Statistic
|
% Difference
|
Month since
advertising
|
Month prior
to advertising
|
|
Evocities.com.au
Sessions
Users
Pageviews
Pages
/ Sessions
Average
Session Duration
Bounce
Rate
Organic
Search
Direct
|
37.00%
28.82%
62.20%
18.39%
71.74%
-9.51%
209.44%
50.50%
|
13,941
10,642
33,210
2.38
02:01
55.12%
5,771
3,293
|
10,176
8,261
20,475
2.01
01:10
60.91%
1,865
2,188
|
|
Evojobs.com.au
Sessions
Users
Pageviews
Pages
/ Sessions
Average
Session Duration
Bounce
Rate
Organic
Search
Direct
|
11.11%
13.77%
13.59%
2.24%
8.95%
-0.45%
12.89%
24.57%
|
38,083
24,573
74,141
1.95
01:34
70.91%
9,241
2,545
|
34,276
21,599
65,268
1.90
01:26
71.23%
8,186
2,043
|
|
Enquiries (through the Evocities website only)
|
97.62%
|
83
|
42
|
Marketing and Public Relations
· the Evocities image and video library will be
refreshed and updated and new case studies will be gathered.
· Evocities PR is now run out of the secretariat from
within Tamworth Regional Council. New PR initiatives include the use of
Instagram and utilising the Evocities blog to refresh the Evocities.com.au
homepage regularly. In addition to maintaining a presence in metropolitan and
regional newspapers and other news outlets, there will be a specific and
separate PR effort to secure coverage in lifestyle focused media.
Website Management
The Evojobs website is
currently being set up to ‘scrape’ job listing from the
Councils’ employment websites and this will continue with the linking of
select major regional NSW employers.
Research - Evocities will conduct further research
to acquire updated information such as the estimated contribution of each
relocated household to the local economy, as well as the broader economic
benefits to the Evocities of attracting new residents, encouraging business
growth and even encouraging tourism and attracting visitors to the
participating regional cities.
Attached in a summary of the Evocities research and survey
information as supplied by the Evocities project officer.
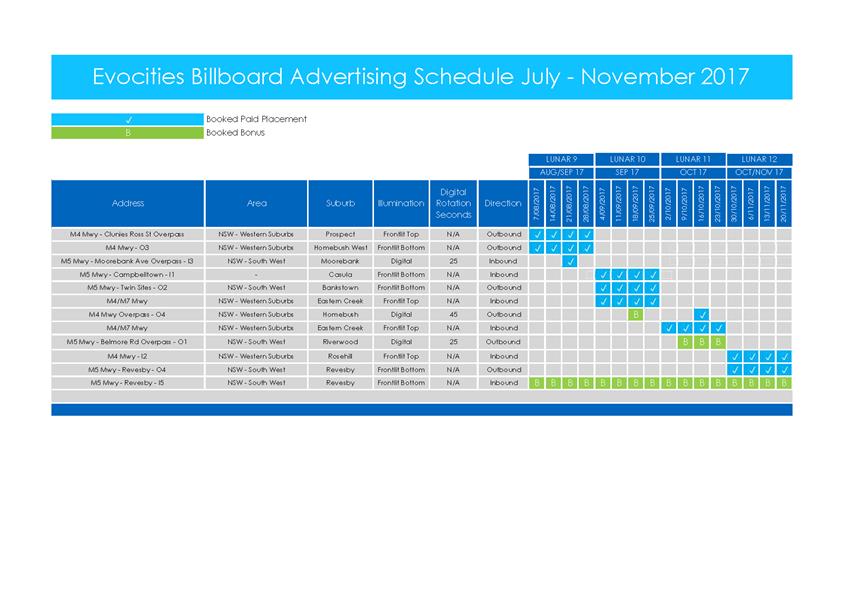
In addition to the above information, Council sought
further details on the marketing activities regarding advertising on motorway
billboards. The schedule for these is attached for
information.
Attachments
1 Addendum
- Evocities Research and Survey Summary 2006 - 2017, D17/52391⇩
2 Evocities
Billboard Schedule August - November 2017, D17/62781⇩