ORANGE CITY COUNCIL
Employment and Economic
Development Policy Committee
Agenda
1 August 2017
Notice
is hereby given, in accordance with the provisions of the Local Government Act
1993 that a Employment and Economic
Development Policy Committee meeting
of ORANGE CITY COUNCIL will be held in the Council Chamber, Civic Centre, Byng Street, Orange on TUESDAY,
1 AUGUST 2017.
Garry
Styles
General Manager
For apologies please
contact Michelle Catlin on 6393 8246.
Employment and Economic Development Policy Committee 1
August 2017
1 Introduction
1.1 Declaration
of pecuniary interests, significant non-pecuniary interests and less than
significant non-pecuniary interests
The
provisions of Chapter 14 of the Local Government Act, 1993 (the Act)
regulate the way in which Councillors and designated staff of Council conduct
themselves to ensure that there is no conflict between their private interests
and their public role.
The
Act prescribes that where a member of Council (or a Committee of Council) has a
direct or indirect financial (pecuniary) interest in a matter to be considered
at a meeting of the Council (or Committee), that interest must be disclosed as
soon as practicable after the start of the meeting and the reasons given for
declaring such interest.
As
members are aware, the provisions of the Local Government Act restrict any
member who has declared a pecuniary interest in any matter from participating
in the discussion or voting on that matter, and requires that member to vacate
the Chamber.
Council’s Code of Conduct provides that if members
have a non-pecuniary conflict of interest, the nature of the conflict must be
disclosed. The Code of Conduct also provides for a number of ways in which a
member may manage non pecuniary conflicts of interest.
|
Recommendation
It is recommended that Committee Members now disclose any
conflicts of interest in matters under consideration by the Employment and
Economic Development Policy Committee at this meeting.
|
2 Committee
Minutes
2.1 Minutes
of the Sister Cities Community Committee Meeting - 12 July 2017
TRIM
REFERENCE: 2017/1618
AUTHOR: Kathy
Woolley, Director Corporate and Commercial Services
EXECUTIVE Summary
The Sister Cities Community Committee met on 12 July 2017
but did not have a quorum. A record of the meeting is presented to the
Employment and Economic Development Policy Committee for information.
Link To Delivery/OPerational Plan
The recommendation in this report relates to the
Delivery/Operational Plan strategy “4.1 Our City –
Continue to deliver a leadership role as a major entity in the region and
actively contribute to the future direction of local, regional and national
initiatives to support and facilitate improved outcomes for the community”.
Financial Implications
Nil
Policy and Governance Implications
Nil
|
Recommendation
That, as there was not a quorum, Council note the
recommendations made by the Sister Cities Community
Committee at its meeting held on 12
July 2017.
|
further considerations
Consideration has been given to the
recommendation’s impact on Council’s service delivery; image and
reputation; political; environmental; health and safety; employees;
stakeholders and project management; and no further implications or risks have
been identified.
SUPPORTING
INFORMATION
The minutes identify that there has been discussion
on a return visit to Mt Hagan by planning staff to update the documents
produced on earlier visits. There would need to be a budget adjustment
made to accommodate this excursion as no funds currently exist for this
project. The Committee has noted that the visit should be deferred at this time
however. When more certainty is available, a budget adjustment via a
quarterly review process can be presented to Council for consideration.
In previous years funding had been available to offset costs of such trips.
Attachments
1 Minutes
of the Meeting of the Sister Cities Community Committee held on 12 July 2017
ORANGE CITY COUNCIL
MINUTES OF THE
Sister Cities Community
Committee
HELD IN Councillors Workroom, Civic Centre, Byng Street,
Orange
ON 12 July 2017
COMMENCING AT 5.30pm
1 Introduction
Cr C Gryllis (Chairperson), Mr G Bargwanna,
Mr G Bloore, Communications Officer (Allan Reeder)
1.1 Apologies and Leave of
Absence
|
RECOMMENDATION Mr
G Bloore/Mrs M Bargwanna
That the apologies be
accepted from Ms Shirie Pirie and Mrs Kerrie Ferguson for the Sister
Cities Community Committee meeting on 12 July 2017.
|
As
there was not a quorum, the members present decided to discuss the agenda and
refer the following record of the meeting for recommendation at the next Sister
Cities Community Committee meeting in the next term of Council.
1.2 Acknowledgement of Country
1.3 Declaration of pecuniary
interests, significant non-pecuniary interests and less than significant
non-pecuniary interests
2 Previous
Minutes
|
RECOMMENDATION Mr
G Bargwanna/Cr C Gryllis
That the minutes of the
meetings of the Sister Cities Community Commitee held on 10 February
2016, 11 May 2016, 10 August 2016 and 15 March 2017 (copies of which were
circulated to all members), are hereby confirmed as a true and accurate
record of the proceedings of the Sister Cities Community Committee held on 10
February 2016, 11 May 2016, 10 August 2016 and 15 March 2017 (noting these
meetings did not have a quorum).
|
3 Presentations
|
TRIM Reference: 2017/1460
|
|
The meeting noted that there had not been any school
exchange visits since the March meeting, and that preliminary planning had
begun for the next Japanese Speaking compeition.
A former winner of the contest had made contact seeking Council
support for a proposed internship in Ushiku, and that more information has
been asked sought.
The meeting noted that the Orange Anglican Grammar Scjpp;
had expressed interest in becoming involved in exchange visits with Ushiku
and proposed discussions with organisers at Canobolas Rural Technology High
School.
|
|
RECOMMENDATION Cr
C Gryllis/Mr G Bargwanna
That the presentation on Ushiku be acknowledged.
|
|
TRIM Reference: 2017/1461
|
|
The meeting noted that the recent visit of two trainees
had been very successful. The Chairperson thanked Mr Jeff Hort for his
enthusiasm and patience over many years which had seen the project through.
The meeting noted that advice had been received from Mt
Hagen that the planned visit by planning staff from Orange to assist with the
review of key planning documents, should be held after the current round of
PNG elections.
|
|
RECOMMENDATION Cr
C Gryllis/Mr G Bargwanna
That the presentation on Mt Hagen be acknowledged.
|
3.3 Update on Orange
(California)
TRIM Reference: 2017/1462
|
|
No update provided.
|
|
TRIM Reference: 2017/1463
|
|
No update provided.
|
|
TRIM Reference: 2017/1464
|
|
No update provided.
|
|
TRIM Reference: 2017/1465
|
|
No update provided.
|
4 General
Reports
4.1 Sister Cities Community
Committee Action List update
TRIM Reference: 2017/1466
|
|
Recommendation Cr C Gryllis/Mr G Bloore
That the Action List for the Sister Cities Community Committee
be reviewed and updated.
|
The Meeting
Closed at 6.00 PM.
3 General
Reports
TRIM
REFERENCE: 2017/1363
AUTHOR: Tony
Boland, Business Projects Officer
EXECUTIVE Summary
At the Council meeting held on 6 June 2017 a question was
taken on notice requesting staff provide information on youth unemployment
figures for Orange.
Link To Delivery/OPerational Plan
The recommendation in this report relates to the
Delivery/Operational Plan strategy “11.1 Our Economy
– Encourage the growth of local business, support emerging industry
sectors and attract new investment to Orange”.
Financial Implications
Nil
Policy and Governance Implications
Nil
|
Recommendation
That the report on Youth Unemployment be acknowledged.
|
further considerations
Consideration has been given to the
recommendation’s impact on Council’s service delivery; image and
reputation; political; environmental; health and safety; employees;
stakeholders and project management; and no further implications or risks have
been identified.
SUPPORTING INFORMATION
Youth unemployment generally refers to people aged 15 to 24
years, but may apply to any age cohort within this span. On this basis, the
supporting information section of this report further quantifies the youth
unemployment data into 15-19 year olds and 20-24 year olds.
Youth unemployment for an individual location or Local
Government Area is only calculated at a Census of Population and Housing. The
unemployment data for the 2016 Census will not be released until October 2017.
This means the most reliable source of data on a Local Government Area basis is
the 2011 Census.
At the time of the 2011 Census, the youth unemployment rate
for the Orange Local Government Area was 10.1%.
The youth unemployment rate is
calculated by taking the number of unemployed people in this age group who are actively
seeking work and dividing by the number of people in the workforce in this
age group. People in full time school, TAFE and University are not considered
to be actively seeking work or in the workforce and therefore are not part of
the count for the purposes of youth unemployment.
The youth unemployment figures for the 2011 Census are:
|
Age
|
Sex
|
Labour Force
|
Unemployed People
|
UE rate
|
|
|
Male
|
660
|
91
|
13.9%
|
|
15-19
|
Female
|
688
|
85
|
12.4%
|
|
|
TOTAL
|
1348
|
176
|
13.1%
|
|
|
Male
|
1032
|
80
|
7.5%
|
|
20-24
|
Female
|
852
|
72
|
8.5%
|
|
|
TOTAL
|
1886
|
152
|
8.1%
|
|
|
Male
|
1692
|
171
|
10.1%
|
|
15-24
|
Female
|
1540
|
157
|
10.2%
|
|
|
TOTAL
|
3234
|
328
|
10.1%
|
Youth Unemployment figures are
usually calculated on a National, State or Statistical Area Level 4 (see map).
Trends at any of these levels may or may not reflect what is happening at the
local government level, but it is not possible to confirm this outside a Census
report.
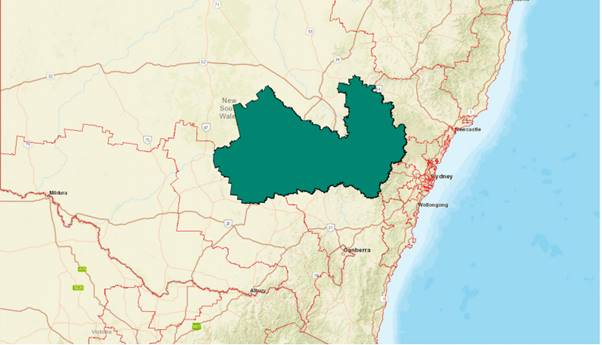
The Central West Statistical Area Level 4 (SA4) is pictured
above. The area is similar to that of the Centroc region and includes the
additional LGAs of Bland and Mid Western Region, but does not include Hilltops
or Upper Lachlan.
As the geography is broad and there are a number of larger
labour markets within the SA4, the reliability of the youth unemployment rate
at the SA4 level is significantly diminished.
The youth unemployment data (15 – 24 years) for the
Central West SA4 is below.
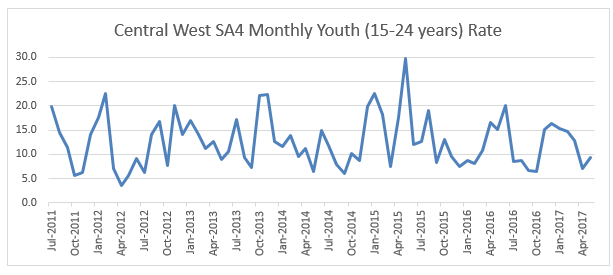
Source: ABS Cat 6291.0.55.001 Labour Force, Australia, Detailed.
The youth unemployment rate for the Orange LGA at the 2011
Census was 10.1%. The Census was held on 9 August 2011. The Central West SA4
youth unemployment rate for August 2011 was 14.4%. As can be observed from the
graph above, the youth unemployment rate fluctuates significantly for the
Central West SA4. It is also not possible to draw a direct correlation between
the Orange LGA and the Central West SA4. For example, the difference between
the Census data and the SA4 data was 4.3%. This does not mean that Orange is
always 4.3% under the SA4 rate as evidenced in the April 2012 SA4 figures of
3.5%. To take 4.3 percentage points of those figures would create a negative
number, which is not possible for unemployment measurement.
In a report produced by Department of Employment (ABS Labour
Force Survey, May 2017), Youth Unemployment percentages across NSW are:
|
Area
|
Youth Unemployment Rate 15 to 24 years
|
|
Central Coast
|
17.1%
|
|
Capital Region
|
10.5%
|
|
Central West
|
11.9%
|
|
Far West and Orana
|
13.2%
|
|
Illawarra
|
13.2%
|
|
Murray
|
12.4%
|
|
New England and North West
|
14.3%
|
|
Riverina
|
15.4%
|
The Capital Region and Central West currently have the lowest
youth unemployment percentage.
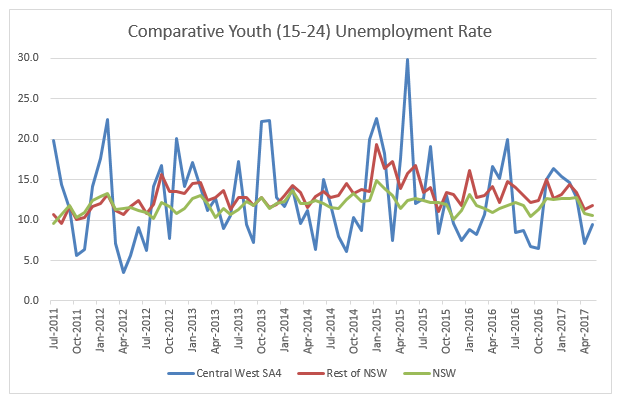
Source: ABS Cat 6291.0.55.001 Labour Force, Australia, Detailed.
The graph measures the youth unemployment rate for the Central
West, NSW excluding Sydney (Rest of NSW) and NSW. There are 14 regional SA4 and
14 Sydney based SA4. Any changes in the Central West SA4 will have more effect
on the Rest of NSW than it will on the NSW result.
The trend for the Rest of NSW is relatively similar to that of
NSW. However, the youth unemployment rate for the Central West SA4 does not
consistently follow the trends of that of Rest of NSW or NSW and the
fluctuations in the Central West rate are more pronounced.
Youth unemployment traditionally has a spike in January which
correlates with people leaving school and not securing a job immediately. This
can be seen in both the NSW and the Rest of NSW results. The results for these
two sets of data also observe a spike in October each year, usually followed by
a sharp decrease in youth unemployment. This trend aligns with students
completing university studies in October and being unemployed and subsequently
finding employment in November.
The results for the Central West SA4 are not as consistent as
the Rest of NSW or NSW results. The Central West results vary from a low of
3.5% (April 2012) to a high of 29.9% (May 2015). In contrast, the NSW results
have a low of 9.6% (July 2011) and a high of 13.9% (January 2015). The Central
West SA4 results often show rising youth unemployment when the Rest of NSW and
NSW indicate declining unemployment.
The collection method of data obtained for the purposes of
measuring youth unemployment on a national, state or regional basis is not
suitable for a smaller geography such as an LGA as it is statistically
unreliable. As can be seen from the previous chart, the smaller the geography,
the more pronounced the fluctuations tend to be. The Census results (due in
October) will give the best indication of the Orange LGA youth unemployment
rate.
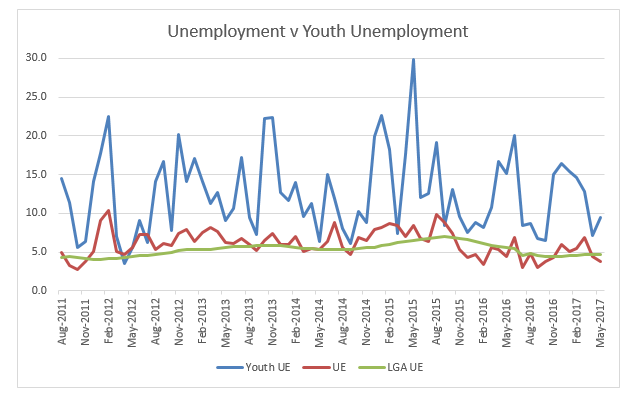
The final chart compares the youth unemployment rate with the
total unemployment rate for the Central West SA4. They are in turn compared
with the total unemployment rate for Orange LGA. The SA4 data is released on a
monthly basis and the LGA data is released on a quarterly basis. The chart
shows that there is some correlation between the total unemployment and the
youth unemployment on an SA4 basis, however the fluctuations in the youth
unemployment are more pronounced in both growth and decline. There is no
significant correlation between the SA4 data and the trend for the Orange LGA.
In a report produced by the NSW Business Chamber, titled a
Workforce Skills Survey on Youth Employment noted that youth unemployment in
Australia is a growing problem. The report showed that businesses are
prepared to provide young people with their first start in the workforce
(42.5%); however respondents of the survey reported a lack of skills (25.7%)
and necessary qualifications (11.2%) as the main reasons for not hiring a young
person. The level of education completed by young people showed 56.6%
high school only, 22.6% vocational qualification (ie: Cert ll, lll or Diploma),
17.7% bachelor degree and 3.2% postgraduate degree.
The report stated the need to improve school to work
transitions for young people, to build their employability, preparations for
work, attitude/personality/motivation, skill development, literacy/ numeracy
and common sense to strengthen their foundation skills required to enter and
stay in the workforce.
The NSW Business Chamber is also undertaking research on
“Laying the Foundations for Apprenticeship Reform”. The research to
date has identified prioritising work readiness training, boosting incentives
for the early stages, and targeting employer support as strategies that will
help build employer confidence and encourage them to create opportunities for
young people looking for a start.
3.2 Quarterly
Update on Unemployment Rates
TRIM
REFERENCE: 2017/1424
AUTHOR: Tony
Boland, Business Projects Officer
EXECUTIVE Summary
Small Area Labour Market (SALM) data for the March 2017
quarter is presented for information.
Link To Delivery/OPerational Plan
The recommendation in this report relates to the
Delivery/Operational Plan strategy “11.1 Our Economy
– Encourage the growth of local business, support emerging industry
sectors and attract new investment to Orange”.
Financial Implications
Nil
Policy and Governance Implications
Nil
|
Recommendation
That the report on the unemployment figures for Orange
be acknowledged.
|
further considerations
The recommendation of this report has been
assessed against Council’s other key risk categories and the following
comments are provided:
|
Service Delivery
|
The data provided within this
report is also provided to companies looking for assistance with information
as well as being used by staff in submissions.
|
SUPPORTING INFORMATION
The figures are published on a quarterly basis by the
Department of Employment in the Small Area Labour Markets publication https://www.employment.gov.au/small-area-labour-markets-publication.
The SALM data is released by the Department of Employment
three to four months after the end of the quarter. The most recent data
available is for the quarter ending 31 March 2017. The data in this report is
on a Local Government Area basis in the first section and then on a city by
city (SA2) basis for the second half of the report. There is additional
information on SA2 geography.
|
Measurement – Orange LGA
|
March Quarter 2017
|
|
Labour force
|
22,405
|
|
Unemployed persons
|
1,056
|
|
Unemployment rate – March
2017
|
4.7%
|
The unemployment rate for the Orange LGA was 5.8% in the
March 2016 quarter. The Department of Employment cautions consideration of
quarter on quarter comparison due to the volatility of the data. It recommends
analysis on year to year basis.
A comparison of the Orange LGA results in the March 2017
quarter to other LGAs is shown in the table below (noting this relates to the
LGAs as they were in March 2017):
|
LGA
|
UE
rate – Dec 2016
|
|
LGA
|
UE
rate –Dec 2016
|
|
Albury
|
6.5%
|
|
Lithgow
|
6.6%
|
|
Armidale
|
6.7%
|
|
Maitland
|
4.5%
|
|
Bathurst
|
4.2%
|
|
Mid-Western
|
5.4%
|
|
Blayney
|
4.0%
|
|
Oberon
|
4.0%
|
|
Cabonne
|
2.9%
|
|
Orange
|
4.7%
|
|
Coffs Harbour
|
5.8%
|
|
Parkes
|
6.9%
|
|
Cowra
|
6.7%
|
|
Port Macquarie
|
4.4%
|
|
Forbes
|
4.4%
|
|
Tamworth
|
6.7%
|
|
Griffith
|
4.3%
|
|
Wagga Wagga
|
4.6%
|
|
Hilltops +
|
5.8%
|
|
Western Plains+
|
3.7%
|
|
|
|
|
NSW
|
5.2%
|
+
Dubbo and Young Councils were amalgamated with other Councils to form new
merged entities.
Previous reports have reported the Dubbo and Young unemployment rate.
The SALM data has been measured for
over 30 years. This information has been provided on a geographic basis where
the boundaries match the appropriate Local Government Area. The graphs in the
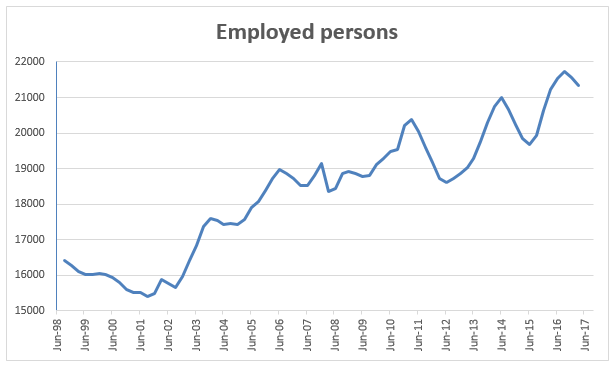
first section below depict the historical data for the Orange LGA.
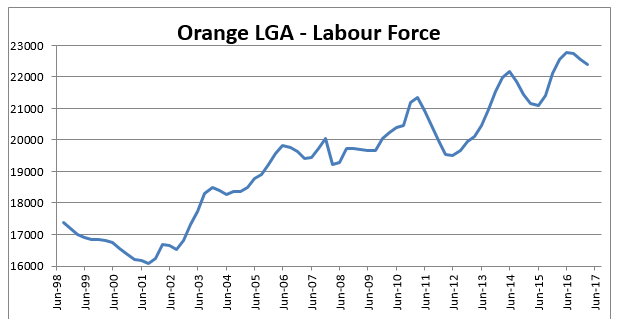
Labour Force
The labour force is the number of persons aged over 15 years
with the exclusion of certain persons, including those in permanent defence
force positions, overseas residents in Australia and some diplomatic roles. The
labour force is the number of non-excluded people who are working or actively
looking for work, so the labour force figure includes people who are
unemployed.
For Orange LGA, the graph below displays a peak in the labour
force in March 2011 which
coincided with a significant number of construction projects including Cadia
East, CSU and new hospital by the Orange Health Service.
The period from December 2013 to September 2014 includes a
significant number of people who relocated for the purposes of the Cadia East
construction project and Orange Airport Development. This is reflected within
our population statistics. September 2014 saw the completion of the last of
these projects, with the conclusion of the Cadia East construction.
From September 2014 to June 2015 there was a significant
reduction in the labour force. This was potentially linked to jobseeker
confidence in the light of the scaling back of Electrolux operations. Jobseeker
confidence and jobs have recovered well for the labour force to be at an
all-time high in June 2016 and still only slightly less than that in the March
2017 quarter.
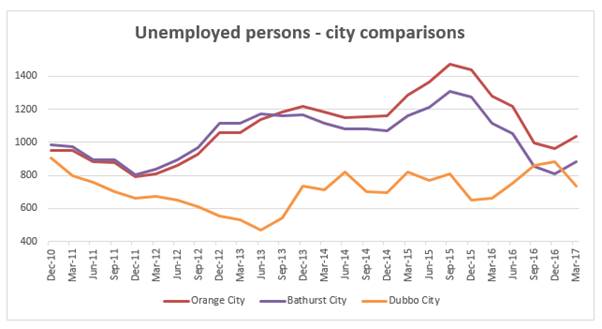
Unemployed
persons
The number of unemployed persons in Orange LGA has
traditionally been less than 1,000 persons.
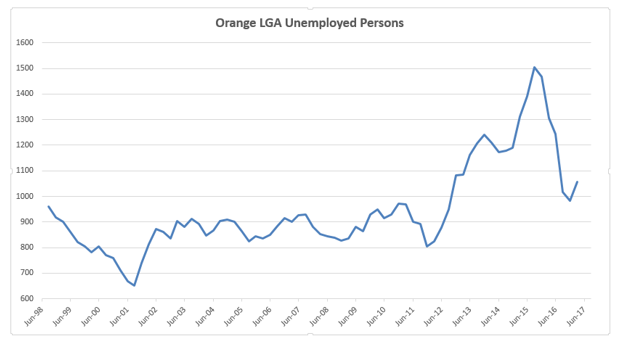
The 1,000 person ‘barrier’ was broken after
September 2012 quarter. This coincided with the completion of a number of large
projects. The number of unemployed continued to climb quarter on quarter (with
the exception of March and June 2014) until a peak of 1,504 was realised in
September 2015 quarter. The current number of unemployed is 1,056.
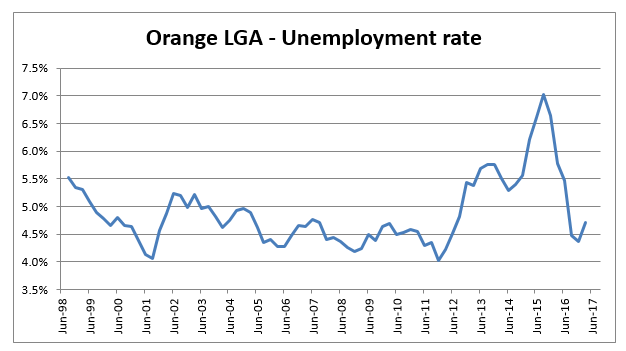
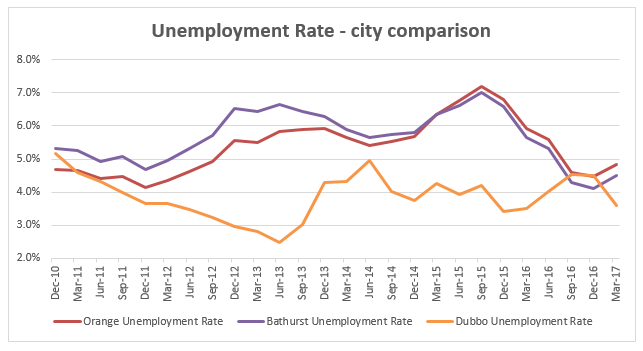
Unemployment rate
The unemployment rate has historically been relatively
conservative in the 4-5 per cent range. The unemployment rate peaked in
September 2015 at 7.0%. This quarter coincided with a significant number of
retrenchments from Electrolux and the reduction of contractors at Cadia Valley
Operations.
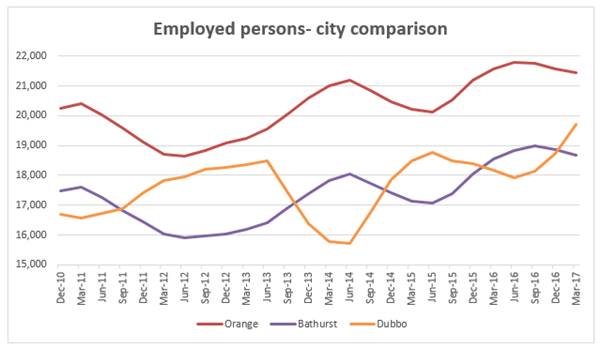
Employed
persons
The figure for employed persons is not reported by the
Department of Employment but is derived by taking the unemployed persons out of
the labour force. The December 2016 quarter saw a slight drop from the highest
ever level of people in employment (21,724 people) achieved in Orange. This
figure is higher than the number of people employed at any time during the
major construction projects or in the mining boom.
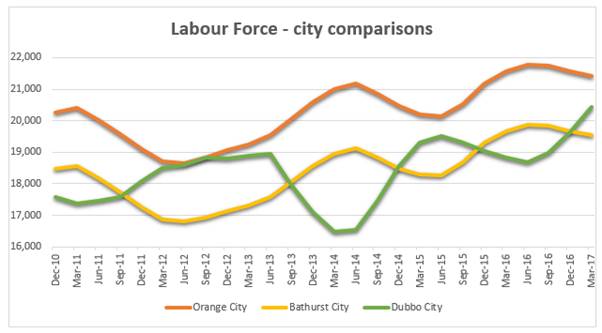
City to City Comparisons
It has become increasingly unreliable to do city to city
comparisons using LGA boundaries as a number of Local Government Areas are now
merged, and therefore increase in geographic and population size. The
Department of Employment now releases employment data using the Australian
Statistical Geography Standard Statistical Area Level 2 geography. This allows
data to be closely matched to the geography of a city as well as a Local
Government Area.
By matching to the geography of a city, direct comparisons can
be made between each city’s labour market rather than guessing how much
of the LGA data is attributable to the city and how much is attributable to
villages and rural communities.
To help put the city based employment data in context, it is
useful to gain an understanding of each city’s population. The table
below shows the estimated residential population for the year ending June 30
for each of the cities.
|
|
2010
|
2011
|
2012
|
2013
|
2014
|
2015
|
2016
|
|
Orange City
|
36,988
|
37,785
|
38,523
|
39,208
|
39,741
|
40,075
|
40,582
|
|
Bathurst City
|
33,328
|
33,754
|
34,203
|
34,855
|
35,369
|
36,013
|
36,701
|
|
Dubbo City
|
35,056
|
35,281
|
35,701
|
36,073
|
36,599
|
36,941
|
37,245
|
The Labour Force for the three cities is contained in the
following graph. Of note, the lines denoting the Orange and Bathurst labour
force almost run parallel over the entire period. Orange has consistently had a
workforce of around 2,000 more people than Bathurst. This is consistent with
having around an extra 4,000 residents in Orange compared to Bathurst.
It is interesting to note in the following two graphs that the
unemployed persons and the unemployed rate for Orange and Bathurst follow a
similar trend while the unemployed persons and rate for Dubbo trends
differently. Some of the similarity in the Orange and Bathurst trends could be
apportioned to the relatively close geographic positioning of the two cities to
each other, allowing flexibility of people to move between the two labour
markets for work. This would help to counter individual city labour market
peaks and troughs in Bathurst and Orange.
The figure for employed persons is not reported by the
Department of Employment but is derived by taking the number of unemployed
persons out of the labour force figure. The graph below shows Orange has around
2,500 more jobs than either Bathurst or Dubbo in December 2016.
3.3 Employment
of Apprentices/Trainees/Cadets at Orange City Council
TRIM
REFERENCE: 2017/1569
AUTHOR: Michael
Ridge, Manager Human Resources
EXECUTIVE Summary
This report provides an overview of Council’s
employment of apprentices, trainees and cadets for Council’s
information. Councillors have asked about the number of
cadets/apprentices/trainees in various meetings and briefings.
Link To Delivery/OPerational Plan
The recommendation in this report relates to the
Delivery/Operational Plan strategy “1.3 Our City -
Ensure a robust framework that supports the community’s and
Council’s current and evolving activities, services and functions”.
Financial Implications
Nil
Policy and Governance Implications
Nil
|
Recommendation
That the report on the employment of
apprentices/trainees and cadets at Orange City Council be acknowledged.
|
further considerations
Consideration has been given to the
recommendation’s impact on Council’s service delivery; image and
reputation; political; environmental; health and safety; employees;
stakeholders and project management; and no further implications or risks have
been identified.
SUPPORTING INFORMATION
Orange City Council has long supported the employment of
apprentices, trainees and cadets across its operations. The employment of
trainees provides benefits to both the trainee and to Council including the
ability to develop employees in areas of skill shortages.
Council currently has 21 trainee positions in the
organisational structure including:
· 2 Horticulture
trainees (City Presentation)
· 2 Horticulture
apprentices (City Presentation)
· 3 trainee Diploma
Trained Educator (Community Services)
· Trainee Drafting
Officer (Engineering Services)
· Apprentice
Mechanic (Plant and Depot)
· Apprentice
Electrician (Water and Sewer)
· Apprentice Plumber
(Water and Sewer)
· Apprentice
Carpenter (Building Maintenance)
· Apprentice Electrician
(Building Maintenance)
· Trainee Ranger
(Building and Environment)
· 3 trainee
Aboriginal Environmental Health Officer (Building and Environment)
· Cadet Engineer
(Water and Sewer) – commencing in 2017/18
· Administration
Trainee (Administration and Governance) – commencing in 2017/18
· Two cadet
Accountant (Financial Services)
These 21 positions represent 5.3% of Council’s total
full time positions.
Some of these positions are currently vacant due to
resignations. They are traditionally recruited towards the end of the year as
students start courses.
In addition to the above, Council has committed to
engaging a further Cadet Engineer through Charles Sturt University new School
of Engineering, each year with the aim of recruiting three of the CSU students.
The first cadet engineer through this program commenced on 3 July 2017.
At recruitment, it is made clear to applicants that
the position is for the term of their apprenticeship/cadetship or traineeship.
As the end of these terms is approaching, managers
assess the operational need with regard to the trainee/cadet/apprentice
position to determine if a new recruitment is to be made. The manager then
considers the salary needs in preparing their budget submissions.
Council has engaged locally based firm Skillset for a
significant period of time to host (employ) apprentice roles. Skillset is a not
for profit organisation with Orange City Council being a member.
Skillset’s role is to provide group training support including recruitment,
support of apprentice, vocational training compliance, host advice, human
resources and payroll services. Council also runs recruitment processes for
other trainee/cadet roles through its recruitment processes.