
ORANGE CITY COUNCIL
Employment and Economic
Development Policy Committee
Agenda
6 June 2017
Notice
is hereby given, in accordance with the provisions of the Local Government Act
1993 that a Employment and Economic
Development Policy Committee meeting
of ORANGE CITY COUNCIL will be held in the Council Chamber, Civic Centre, Byng Street, Orange on Tuesday,
6 June 2017.
Garry
Styles
General Manager
For apologies please
contact Michelle Catlin on 6393 8246.
Employment and Economic Development Policy Committee 6
June 2017
1 Introduction
1.1 Declaration
of pecuniary interests, significant non-pecuniary interests and less than
significant non-pecuniary interests
The
provisions of Chapter 14 of the Local Government Act, 1993 (the Act)
regulate the way in which Councillors and designated staff of Council conduct
themselves to ensure that there is no conflict between their private interests
and their public role.
The
Act prescribes that where a member of Council (or a Committee of Council) has a
direct or indirect financial (pecuniary) interest in a matter to be considered
at a meeting of the Council (or Committee), that interest must be disclosed as
soon as practicable after the start of the meeting and the reasons given for declaring
such interest.
As
members are aware, the provisions of the Local Government Act restrict any
member who has declared a pecuniary interest in any matter from participating
in the discussion or voting on that matter, and requires that member to vacate
the Chamber.
Council’s Code of Conduct provides that if members
have a non-pecuniary conflict of interest, the nature of the conflict must be
disclosed. The Code of Conduct also provides for a number of ways in which a
member may manage non pecuniary conflicts of interest.
|
Recommendation
It is recommended that Committee Members now disclose any
conflicts of interest in matters under consideration by the Employment and
Economic Development Policy Committee at this meeting.
|
2 General
Reports
2.1 Quarterly
Housing Data for Orange and the Region
TRIM
REFERENCE: 2017/237
AUTHOR: Tony
Boland, Business Projects Officer
EXECUTIVE Summary
At the meeting of 7 February 2017, a question was taken on
notice for Council to receive regular reports on property sales in Orange.
Link To Delivery/OPerational Plan
The recommendation in this report relates to the
Delivery/Operational Plan strategy “11.1 Our Economy – Encourage
the growth of local business, support emerging industry sectors and attract new
investment to Orange”.
Financial Implications
Nil
Policy and Governance Implications
Nil
|
Recommendation
That the report on housing data for Orange and the
region be acknowledged.
|
further considerations
Consideration has been given to the recommendation’s
impact on Council’s service delivery; image and reputation; political;
environmental; health and safety; employees; stakeholders and project
management; and no further implications or risks have been identified.
SUPPORTING
INFORMATION
The most comprehensive reports on property sales and rental
data is published by Housing NSW. Council has used other data sources to
supplement the Housing NSW information.
There are two other commonly reported sources of data on
housing prices:
· RP Data (trading
as CoreLogic)
· Domain
(combination of former Australian Property Monitors and Pricefinder and owned
by Fairfax media)
Both of these sources are more
commonly reported in the media, however the source of the data and the
methodology applied to the collection and inclusion of the data makes these
sources less certain to use. The only advantage of these data sources is that
they are more ‘real time’ than the Housing NSW data.
The supporting information in this
report is broken into five categories:
· median
sales price
· mean
sales price
· number
of sales
· median rental
price
· building approvals
Median
Sales Price
The information surrounding housing
sales and rent data is reported in terms of a median price.
The Housing NSW sales data is captured three months after
the end of the reporting period. On average, around 80% of all sales contracts
have been notified in this timeframe. Statistical analysis and testing by
Housing NSW has shown that the housing mean and median prices do not vary
greatly if data is captured at the six month point. The sales statistics are
derived from information provided on the “Notice of Sale or Transfer of
Land” form that is lodged with Land and Property Information NSW.
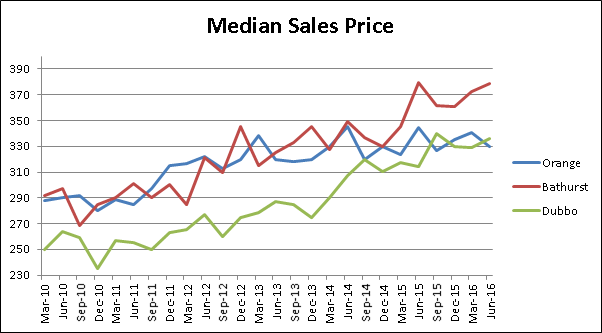
The Housing NSW median sales price in Orange in the June
2016 quarter was $336,000, down from a peak of $345,000 in June 2015. This is
less than both Bathurst and Dubbo as shown in the graph below.
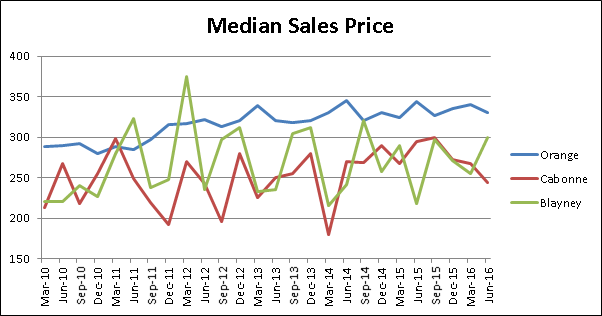
Due to the smaller nature of both the
Cabonne and Blayney residential housing sales markets, the median sales price
is subject to increased volatility in pricing as can be seen in the graph below.
Data from other sources can fluctuate significantly from the
Housing NSW data. As an example, the median price listed by RP Data on 10
February 2017 was $345,000 and the median price from Domain for 2016 was
$347,000. The median listed by Domain in their 2017 Domain House Price Report
was $368,000.
The net growth in the median sales price for Dubbo and
Bathurst for the period March 2010 to June 2016 was more than double that of
Orange.
Mean Sales Price
The mean (average) sales price from Housing NSW is reported on
a Statistical Area Level 3 (SA3) basis. The Orange SA3 is very similar to the
local government areas of Orange, Cabonne and Blayney but doesn’t include
Eugowra or Canowindra. The Bathurst SA3 aligns closely with the boundaries for
Bathurst and Oberon LGAs.
When calculating a mean price, Housing NSW excludes the top 5%
and bottom 5% of sales from each LGA to account for any anomalies or
aberrations in the housing market sales. The result is a more accurate
reflection of the true average price for the market.
The Dubbo SA3 includes parts or all of the LGAs of: Dubbo;
Narromine; Wellington; Coonabarabran; and Gilgandra. The size of this SA3 makes
comparison to Orange and Bathurst impractical.
The mean house price for the June 2016 quarter for Orange SA3
was $333,000 and for the Bathurst SA3 it was $387,000.
Number of Sales
Identifying the number of houses sold in a twelve month period
is not possible through the Housing NSW reports. The two commercial sources
listed the number of units and houses sold as 738 and 729 respectively for
Orange. Comparatively, Bathurst was listed at 456 and 533 sales by the two
sources and Dubbo was listed as 507 (there was an error with one of the Dubbo
listings).
As the commercial sources would not be reporting houses that
haven’t been sold, the variation in the figures are likely to be
attributed to market share or some slight differences in geography. So, along
with using the only available Dubbo result, the number of sales over the
previous year are:
· Orange
- 738
· Bathurst
- 556
· Dubbo
- 468
According to realestate.com.au (RP Data), the number of house
sales in Orange each calendar year over the past 9 years are:
|
|
2008
|
2009
|
2010
|
2011
|
2012
|
2013
|
2014
|
2015
|
2016
|
|
Orange
|
348
|
492
|
585
|
732
|
569
|
562
|
630
|
811
|
752
|
|
Bathurst
|
223
|
353
|
299
|
421
|
417
|
443
|
444
|
570
|
556
|
The turnover in housing is
consistently higher in Orange than in Bathurst. This could be for a number of
reasons including:
· More
people using Orange as a stepping stone in their career path
· Orange
has a larger population therefore a higher turnover is expected
· Lack
of supply and increased demand could be driving up the Bathurst price
· The
construction of new homes has not been able to keep pace as well in Bathurst.
Currently in Orange, the number of properties for sale across
the 17 real estate agents listed in Council’s Business Directory range
from 13 to 49. Most of these properties are listed online with each
individual business, or on domain and real estate. When searching Orange
current real estate market, 564 properties are listed on domain and 622
properties on real estate. Both of these sites have duplication of
listings.
The current sales turnover of housing in Orange is
steady. The sales turnover is influenced by the appropriateness of the
pricing and the location of the property. Properties over $500,000 are slower
to sell and properties under $400,000 are faster.
Median Rental Price
The rental statistics from Housing NSW is derived from
information provided on the rental bond lodgement form that is lodged with the
Office of Fair Trading. Where there are less than 10 bonds lodged in a quarter
the data will return a nil result.
The median rents for the region in the September 2016 quarter
are listed in the following table. The areas are Local Government Area
boundaries.
|
Type
|
All Dwellings
|
Separate Houses
|
Flats/Units
|
|
Bedrooms
|
1
|
2
|
3
|
4
|
2
|
3
|
1
|
2
|
|
|
|
|
|
|
|
|
|
|
Orange
|
208
|
250
|
310
|
395
|
270
|
310
|
210
|
240
|
|
Bathurst
|
190
|
260
|
320
|
420
|
268
|
320
|
190
|
260
|
|
Dubbo
|
178
|
250
|
320
|
380
|
270
|
315
|
175
|
230
|
|
Cabonne
|
-
|
-
|
250
|
280
|
-
|
250
|
-
|
-
|
|
Blayney
|
-
|
210
|
250
|
335
|
-
|
265
|
-
|
-
|
The rent for a one bedroom unit is higher in Orange than both
Bathurst and Dubbo. The rent for a two bedroom unit in Bathurst is
significantly higher than for a one bedroom unit. The prices for 2 and 3
bedroom separate houses is very similar across Orange, Bathurst and Dubbo while
a four bedroom house brings significantly more in Bathurst than Orange or
Dubbo.
The rental costs for 3 and 4 bedroom houses were at an
all-time high between June 2011 and September 2012. This was a period of
intense commercial and mining construction with a number of projects going on
in and around the city. Accommodation at that time was at an absolute premium,
driving up the price.
Building approvals
The number of building approvals is a key indicator in the
confidence and growth of a geographic location. While not all approvals
graduate to the commencement of construction, it is a consistent way to measure
potential building activity between regions and from year to year. This
information is from the Australian Bureau of Statistics (Category 8731.0
– Building Approvals).
The table below shows the comparison between the cities (not
LGAs) of Orange, Bathurst and Dubbo. The three measures are new houses
(houses), other new residential premises (other) and the total numbers of new
residential premises approved (Total).
|
|
|
2010/11
|
2011/12
|
2012/13
|
2013/14
|
2014/15
|
2015/16
|
2016/17
|
|
Orange
|
Houses
|
133
|
248
|
287
|
305
|
283
|
269
|
141
|
|
Other
|
2
|
19
|
20
|
14
|
21
|
193
|
10
|
|
Total
|
135
|
267
|
307
|
319
|
304
|
462
|
151
|
|
Bathurst
|
Houses
|
52
|
118
|
171
|
203
|
196
|
293
|
115
|
|
Other
|
0
|
38
|
64
|
58
|
116
|
77
|
13
|
|
Total
|
52
|
156
|
235
|
261
|
312
|
370
|
128
|
|
Dubbo
|
Houses
|
61
|
139
|
168
|
232
|
251
|
303
|
142
|
|
Other
|
20
|
26
|
20
|
112
|
58
|
87
|
64
|
|
Total
|
81
|
165
|
188
|
344
|
309
|
390
|
206
|
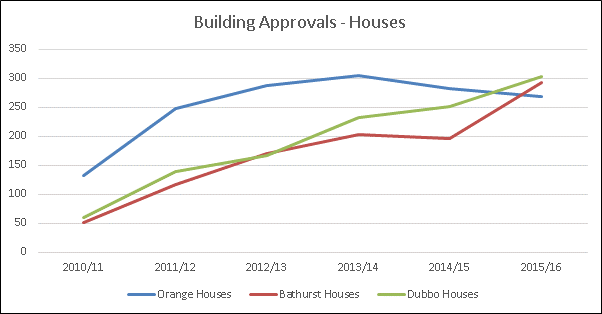
There was a rapid growth in building approvals in 2011. This
rapid growth has been sustained and was still at 269 at the end of last
financial year. This rapid growth in approvals (and subsequent construction)
would have contributed to keeping the median sales and rent prices in check in
Orange. Both Dubbo and Bathurst experienced a steady growth in approvals over
the same period. Although they had a higher number of approvals last financial
year, they both had less net approvals over the same period, potentially
leading to shortage in supply and driving up the median sales price.
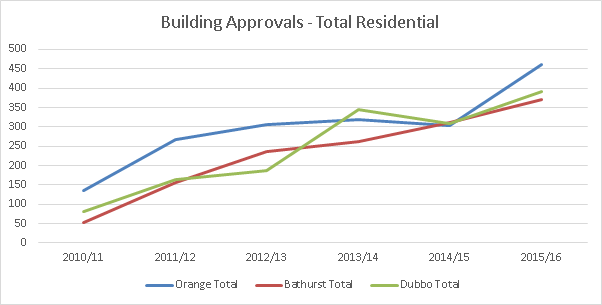
The total building approvals for Orange shows a rapid growth
from 30/6/14 to 30/6/15. This growth is in spite of a reduction of houses being
approved in the same period. For the majority of the time the total residential
approvals in Orange are higher than in Bathurst and Dubbo. This will be in part
from having a larger population.
2.2 Update
on Quarterly Unemployment Data for Orange
TRIM
REFERENCE: 2017/815
AUTHOR: Tony
Boland, Business Projects Officer
EXECUTIVE Summary
At the Employment and Economic Development Policy Committee
meeting of 3 May 2016, Council requested that the quarterly unemployment
figures be reported to Council.
The Federal Department of Employment compiles and reports
Small Area Labour Market (SALM) data. This report provides the most recently
published data.
Link To Delivery/OPerational Plan
The recommendation in this report relates to the
Delivery/Operational Plan strategy “11.1 Our Economy – Encourage
the growth of local business, support emerging industry sectors and attract new
investment to Orange”.
Financial Implications
Nil
Policy and Governance Implications
Nil
|
Recommendation
That the report by the Business Projects Officer on Unemployment
Figures for Orange be acknowledged.
|
further considerations
The recommendation of this report has been assessed against
Council’s other key risk categories and the following comments are
provided:
|
Service Delivery
|
The data provided within this
report is also provided to companies looking for assistance with information
as well as being used by staff in submissions.
|
SUPPORTING INFORMATION
The figures are published on a quarterly basis by the
Department of Employment in the Small Area Labour Markets publication https://www.employment.gov.au/small-area-labour-markets-publication.
The SALM data is released by the Department of Employment
three to four months after the end of the quarter. The most recent data
available is for the quarter ending 31 December 2016. The data in this report
is on a Local Government Area basis in the first section and then on a city by
city (SA2) basis for the second half of the report. There is additional
information on SA2 geography in the second part of the report.
|
Measurement – Orange LGA
|
December Qtr 2016
|
|
Labour force
|
22,555
|
|
Unemployed persons
|
983
|
|
Unemployment rate – September
2016
|
4.4%
|
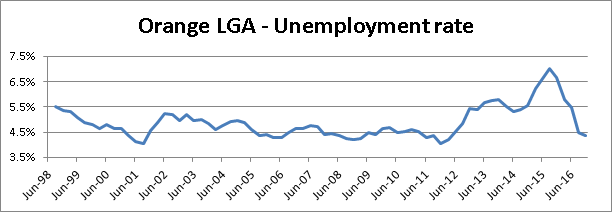
The unemployment rate for the Orange LGA was 6.6% in the
December 2015 quarter. The Department of Employment cautions consideration of
quarter on quarter comparison due to the volatility of the data. It recommends
analysis on year to year basis.
A comparison of the Orange LGA results in the December 2016
quarter to other LGAs is shown in the table below (noting this relates to the
LGAs as they were in December 2016):
|
LGA
|
UE
rate – Dec 2016
|
|
LGA
|
UE
rate –Dec 2016
|
|
Albury
|
7.4%
|
|
Lithgow
|
6.2%
|
|
Armidale
|
7.1%
|
|
Maitland
|
4.4%
|
|
Bathurst
|
3.9%
|
|
Mid-Western
|
5.2%
|
|
Blayney
|
3.8%
|
|
Oberon
|
3.7%
|
|
Cabonne
|
2.8%
|
|
Orange
|
4.4%
|
|
Coffs Harbour
|
3.4%
|
|
Parkes
|
6.5%
|
|
Cowra
|
6.2%
|
|
Port Macquarie
|
4.6%
|
|
Forbes
|
4.2%
|
|
Tamworth
|
7.2%
|
|
Griffith
|
4.1%
|
|
Wagga Wagga
|
4.3%
|
|
Hilltops +
|
5.0%
|
|
Western Plains+
|
4.7%
|
|
|
|
|
NSW
|
5.2%
|
+
Dubbo and Young Councils were amalgamated with other Councils to form new
merged entities.
Previous reports have reported the Dubbo and Young unemployment rate.
The SALM data has been measured for
over 30 years. This information has been provided on a geographic basis where
the boundaries match the appropriate Local Government Area. The graphs in the
first section below depict the historical data for the Orange LGA. Data has
only been collected on a SA2 basis since 2010. There are two or three SA2 areas
that form an equivalent geographical area to each of the cities.
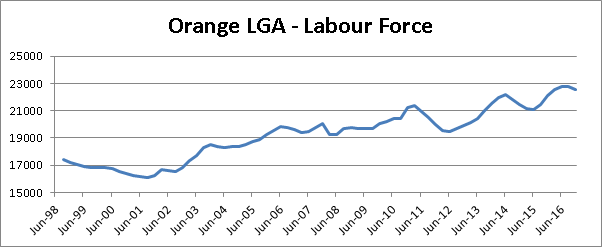
Labour Force
The labour force is the number of persons aged over 15 years
with the exclusion of certain persons, including those in permanent defence
force positions, overseas residents in Australia and some diplomatic roles. The
labour force is the number of non-excluded people who are working or actively
looking for work, so the labour force figure includes people who are
unemployed.
For Orange LGA, the graph below displays a peak in the labour
force in March 2011 which
coincided with a significant number of construction projects including Cadia
East, CSU and new hospital by the Orange Health Service.
The period from December 2013 to September 2014 includes a
significant number of people who relocated for the purposes of the Cadia East
construction project and Orange Airport Development. This is reflected within
our population statistics. September 2014 saw the completion of the last of
these projects, with the conclusion of the Cadia East construction.
From September 2014 to June 2015 there was a significant
reduction in the labour force. This was potentially linked to jobseeker
confidence in the light of the scaling back of Electrolux operations. Jobseeker
confidence and jobs have recovered well for the labour force to be at an all
time high in June 2016 and only slightly less than that in the September 2016
quarter.
Unemployed
persons
The number of unemployed persons in Orange LGA has
traditionally been less than 1,000 persons.
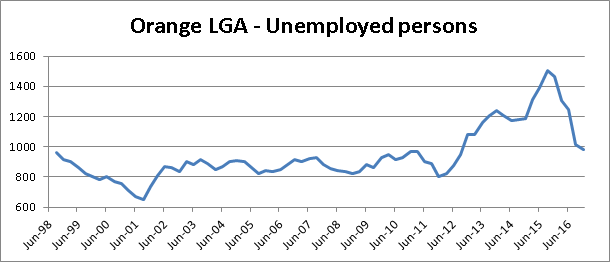
The 1,000 person ‘barrier’ was broken after
September 2012 quarter. This coincided with the completion of a number of large
projects. The number of unemployed continued to climb quarter on quarter (with
the exception of March and June 2014) until a peak of 1,504 was realised in
September 2015 quarter.
There was a rapid decline in the number of unemployed people
(to 1,018) in the twelve months from September 2015 to September 2016. This is
a net reduction of 486 unemployed people over the twelve month period. The
labour force also increased by 1047 people in this same period. This decline
continued in the December quarter, albeit at a lesser rate of decline.
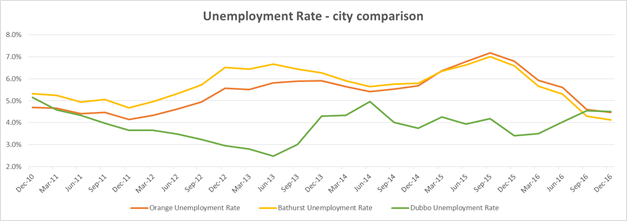
Unemployment rate
The unemployment rate has historically been relatively
conservative in the 4-5 per cent range. The unemployment rate peaked in
September 2015 at 7.0%. This quarter coincided with a significant number of
retrenchments from Electrolux and the reduction of contractors at Cadia Valley
Operations.
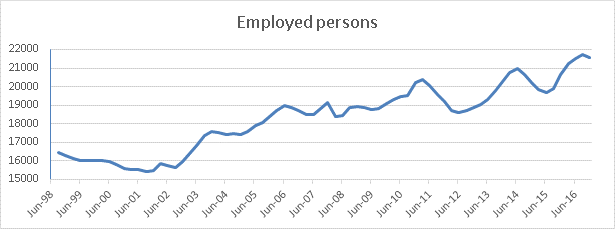
Employed
persons
The figure for employed persons is not reported by the
Department of Employment but is derived by taking the unemployed persons out of
the labour force. The December 2016 quarter saw a slight drop from the highest
ever level of people in employment (21,724 people) achieved in Orange. This
figure is higher than the number of people employed at any time during the
major construction projects or in the mining boom.
City to City Comparisons
It has become increasingly unreliable to do city to city
comparisons using LGA boundaries as a number of Local Government Areas are now
merged, and therefore increase in geographic and population size. The
Department of Employment now releases employment data using the Australian
Statistical Geography Standard Statistical Area Level 2 geography. This allows
data to be closely matched to the geography of a city as well as a Local
Government Area.
By matching to the geography of a city, direct comparisons can
be made between each city’s labour market rather than guessing how much
of the LGA data is attributable to the city and how much is attributable to
villages and rural communities.
To help put the city based employment data in context, it is
useful to gain an understanding of each city’s population. The table
below shows the estimated residential population for the year ending June 30
for each of the cities.
|
|
2010
|
2011
|
2012
|
2013
|
2014
|
2015
|
2016
|
|
Orange City
|
36,988
|
37,785
|
38,523
|
39,208
|
39,741
|
40,075
|
40,582
|
|
Bathurst City
|
33,328
|
33,754
|
34,203
|
34,855
|
35,369
|
36,013
|
36,701
|
|
Dubbo City
|
35,056
|
35,281
|
35,701
|
36,073
|
36,599
|
36,941
|
37,245
|
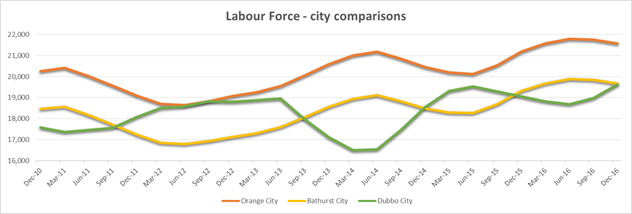
The Labour Force for the three cities is contained in the
following graph. Of note, the lines denoting the Orange and Bathurst labour
force almost run parallel over the entire period. Orange has consistently had a
workforce of around 2,000 more people than Bathurst. This is consistent with
having around an extra 4,000 residents in Orange compared to Bathurst.
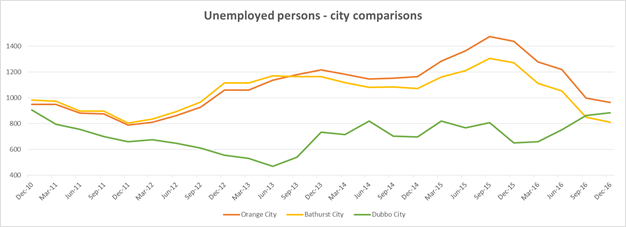
It is interesting to note in the following two graphs that the
unemployed persons and the unemployed rate for Orange and Bathurst follow a
similar trend while the unemployed persons and rate for Dubbo trends
differently. Some of the similarity in the Orange and Bathurst trends could be
apportioned to the relatively close geographic positioning of the two cities to
each other, allowing flexibility of people to move between the two labour
markets for work. This would help to counter individual city labour market peaks
and troughs in Bathurst and Orange.
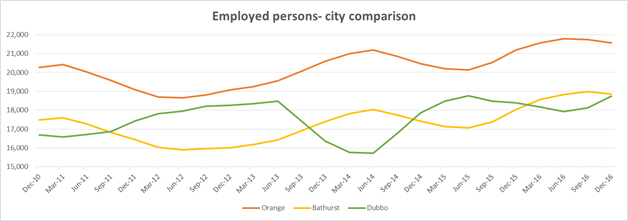
The figure for employed persons is not reported by the
Department of Employment but is derived by taking the number of unemployed
persons out of the labour force figure. The graph below shows Orange has around
2,500 more jobs than either Bathurst or Dubbo in December 2016.
Impact of Council’s Jobs Creation Strategy on local
jobs
Council has allocated $110,000 p.a. to its Jobs Creation
Strategy initiatives over a 10 year period. The Grow Local Campaign was
one of the initiatives funded where Council obtained matching funding from the
NSW Government in a program designed to assist local businesses impacted by the
closing of the Electrolux factory and other structural changes that could
impact on jobs.
An example of the impact of Council’s efforts in
supporting local businesses is provided to illustrate how even a small
allocation can have a large impact.
One of the local businesses assisted was Wangarang.
Wangarang is a local not for profit company that operates as
an Australian Disability Enterprise (ADE). An ADE is partially funded through
government funds and grants but it must find the majority of its funding
through work sought and gained in the private marketplace.
A significant proportion of Wangarang’s income in the
past has been from work performed for Electrolux. Wangarang was awarded a Grow
Local grant in January 2016 to assist with a marketing plan and delivery. The
grant was awarded based on the effect on business from the downturn at Electrolux
(primarily) and Cadia (secondary). The grant proved to be effective in stemming
the loss of work to Wangarang by attracting new business.
A significant further reduction in the work from Electrolux
occurred in April and September/October of 2016. The program allowed for a
second grant in extenuating circumstances but not within the same financial
year. As such, Wangarang was approved for a second grant to market additional
and alternative sources for work. This proved successful again in supporting
the employees within the business with alternative, meaningful work.
The net result was that 52 full time, 105 part time and 8
casual staff still have a job. Wangarang faced the biggest challenges of any
company with the closure of Electrolux, yet with the assistance of the Grow
Local program and the buoyancy in the local economy and labour market, not one
position was lost and an income stream from Electrolux has been effectively
replaced.